A rust drawing library for high quality data plotting for both WASM and native, statically and realtimely 🦀 📈🚀
Plotters - A Rust drawing library focusing on data plotting for both WASM and native applications 🦀📈🚀




Plotters is a drawing library designed for rendering figures, plots, and charts, in pure Rust. Plotters supports various types of back-ends, including bitmap, vector graph, piston window, GTK/Cairo and WebAssembly.
- A new Plotters Developer's Guide is a work in progress. The preview version is available here.
- Try Plotters with an interactive Jupyter notebook, or view here for the static HTML version.
- To view the WASM example, go to this link
- Currently we have all the internal code ready for console plotting, but a console based backend is still not ready. See this example for how to plot on console with a customized backend.
- Plotters has moved some backend code to separate repositories, check FAQ list for details
- Some interesting demo projects are available, feel free to try them out.
Gallery
To view the source code for each example, please click on the example image.
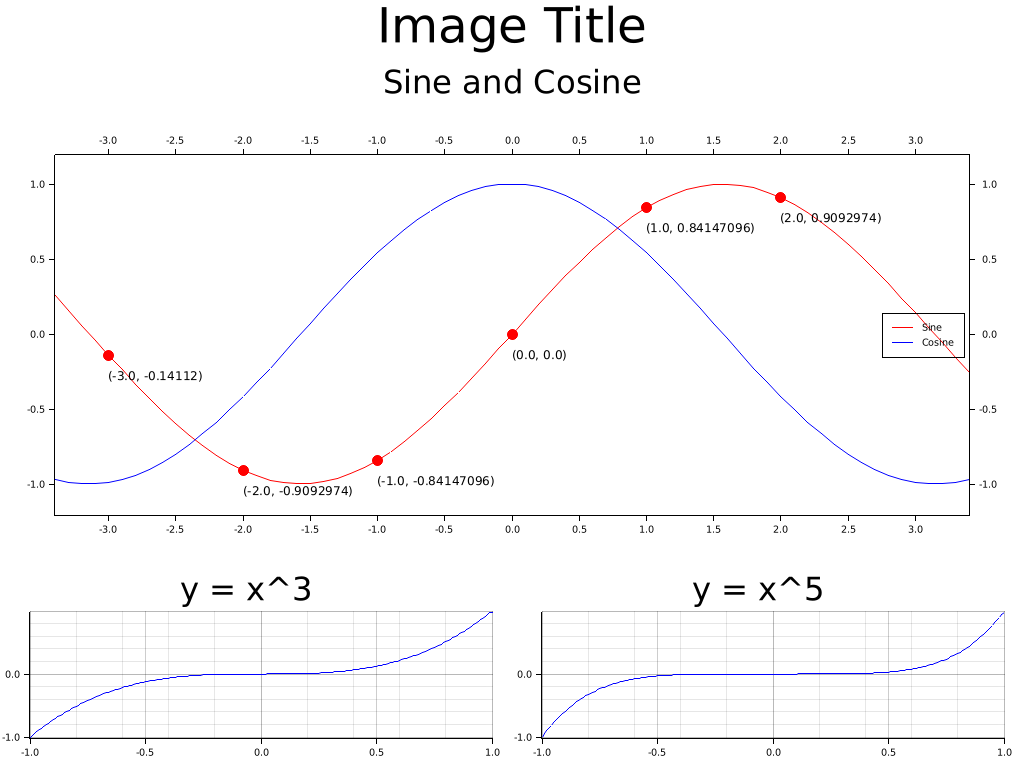
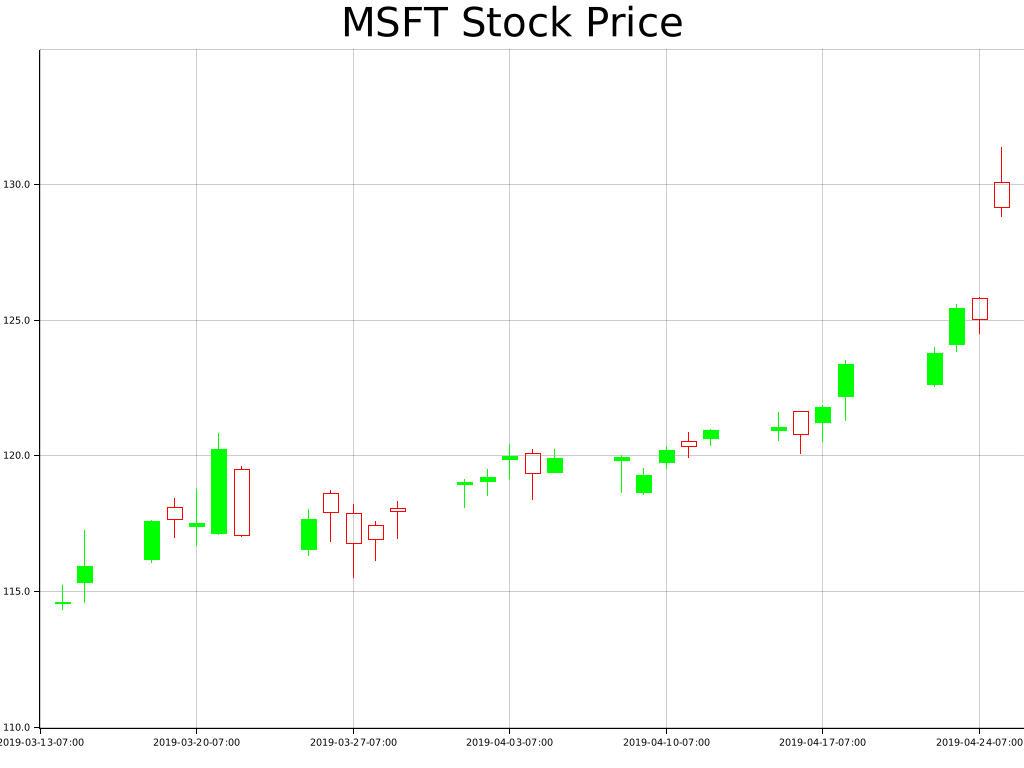
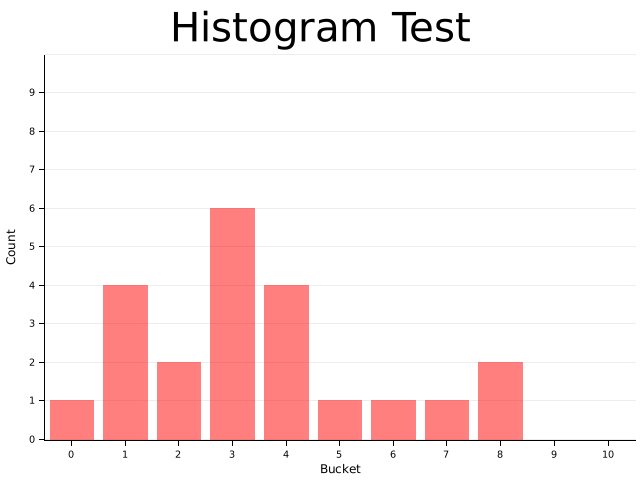
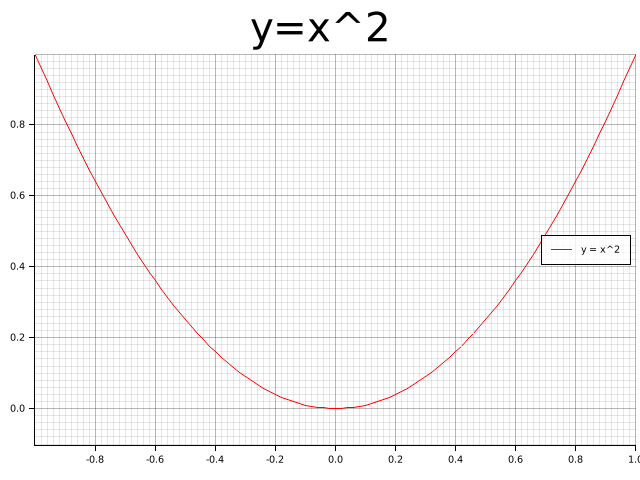
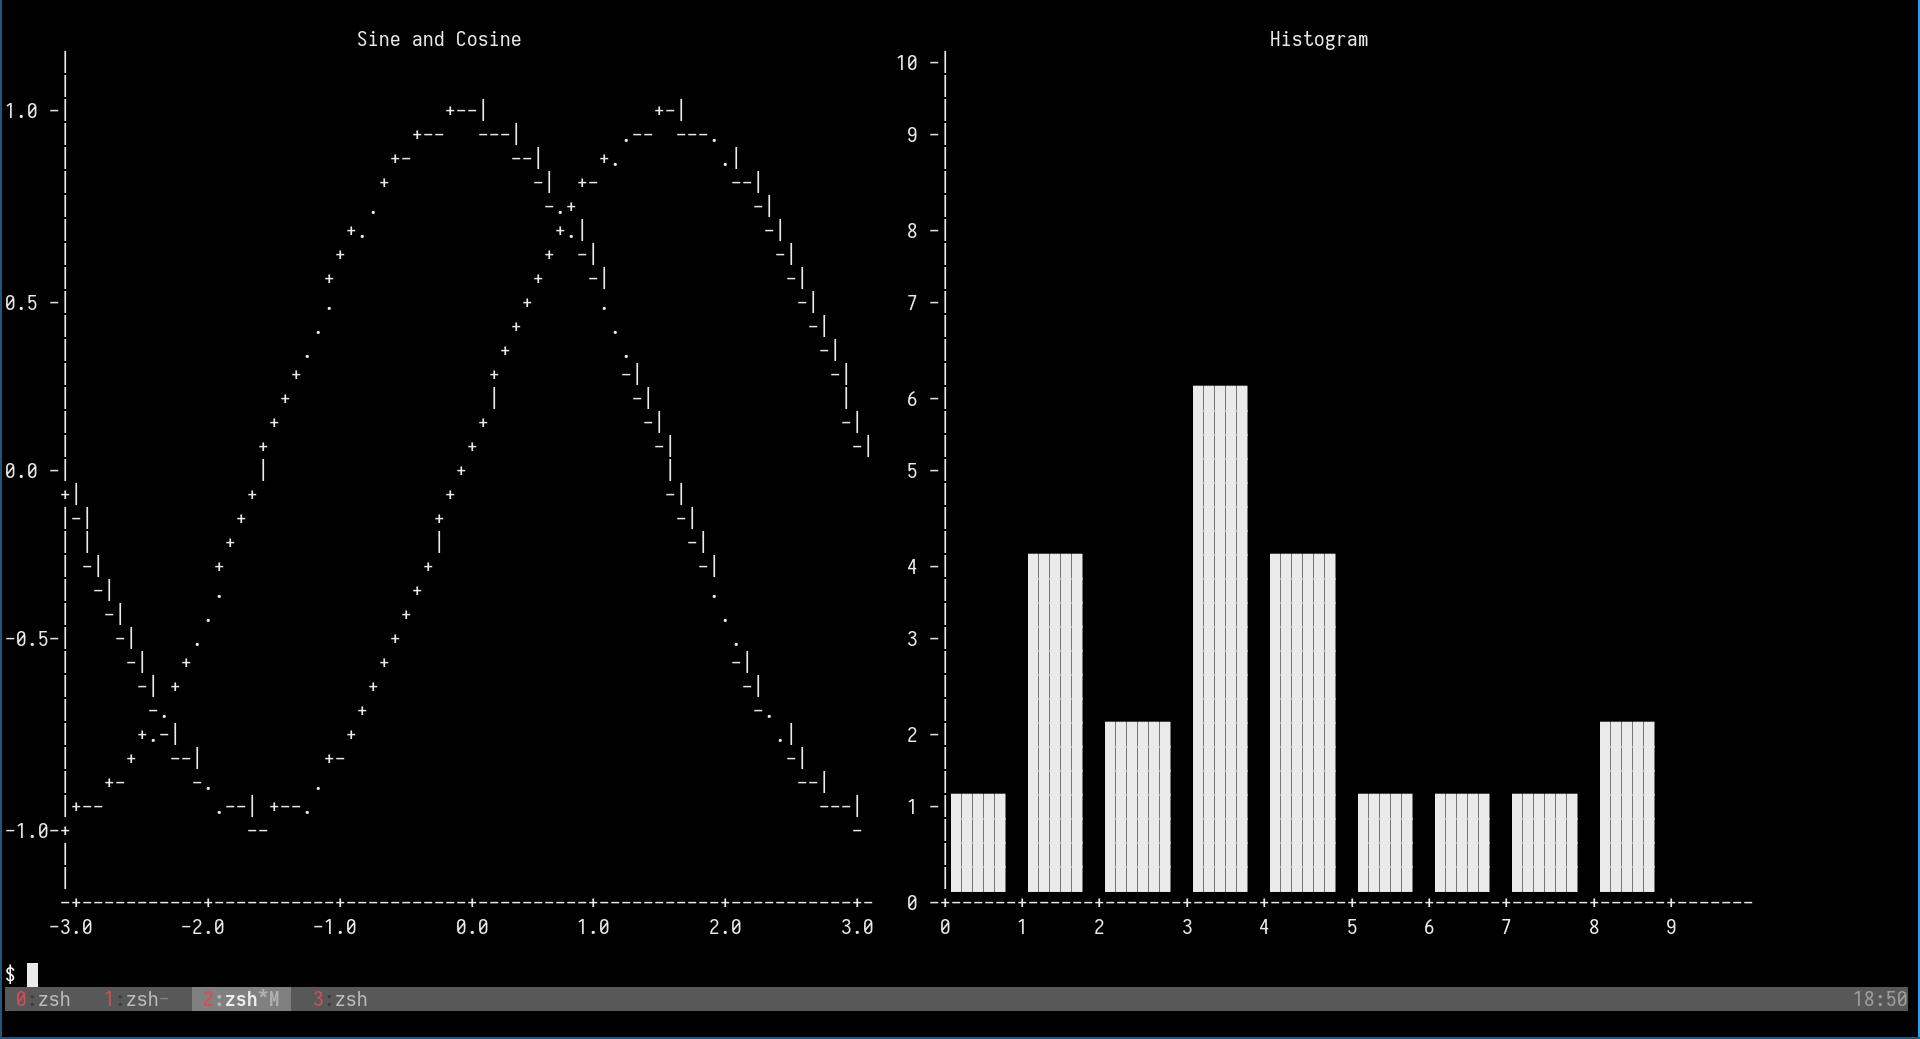
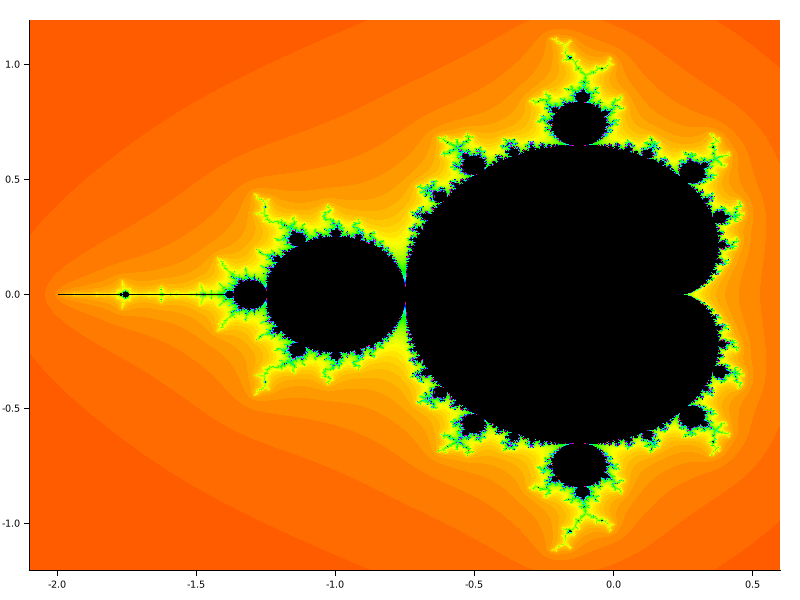
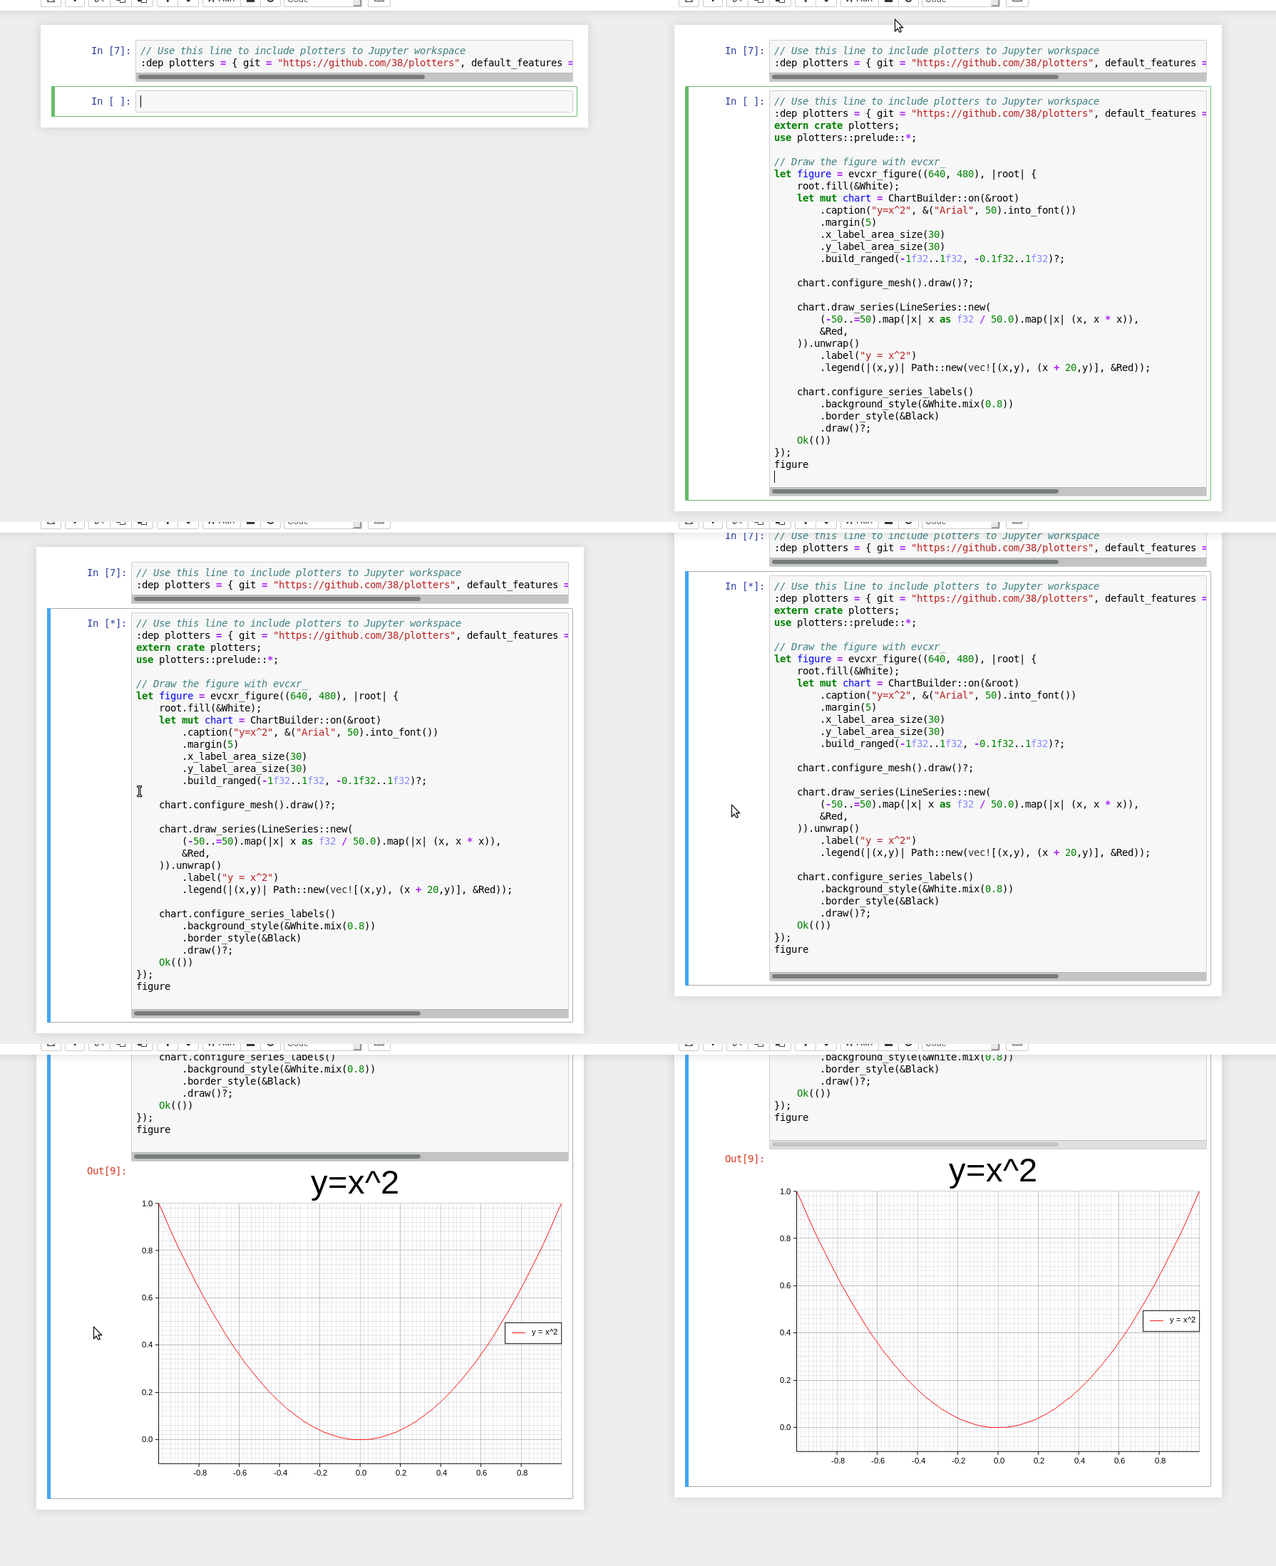

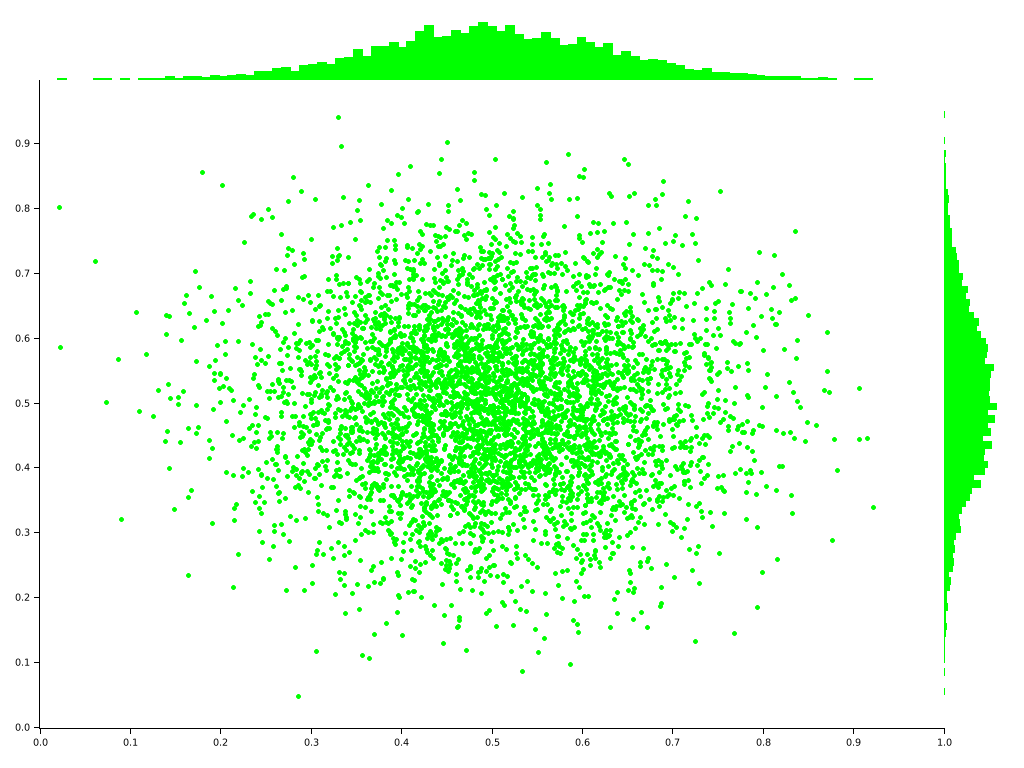
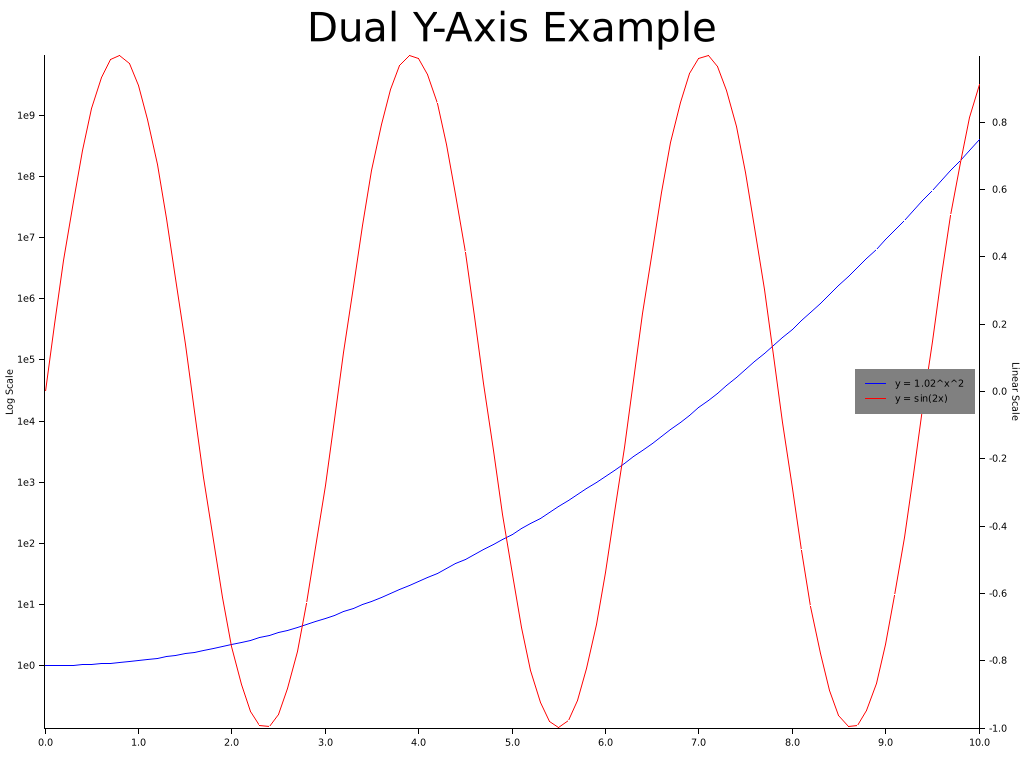
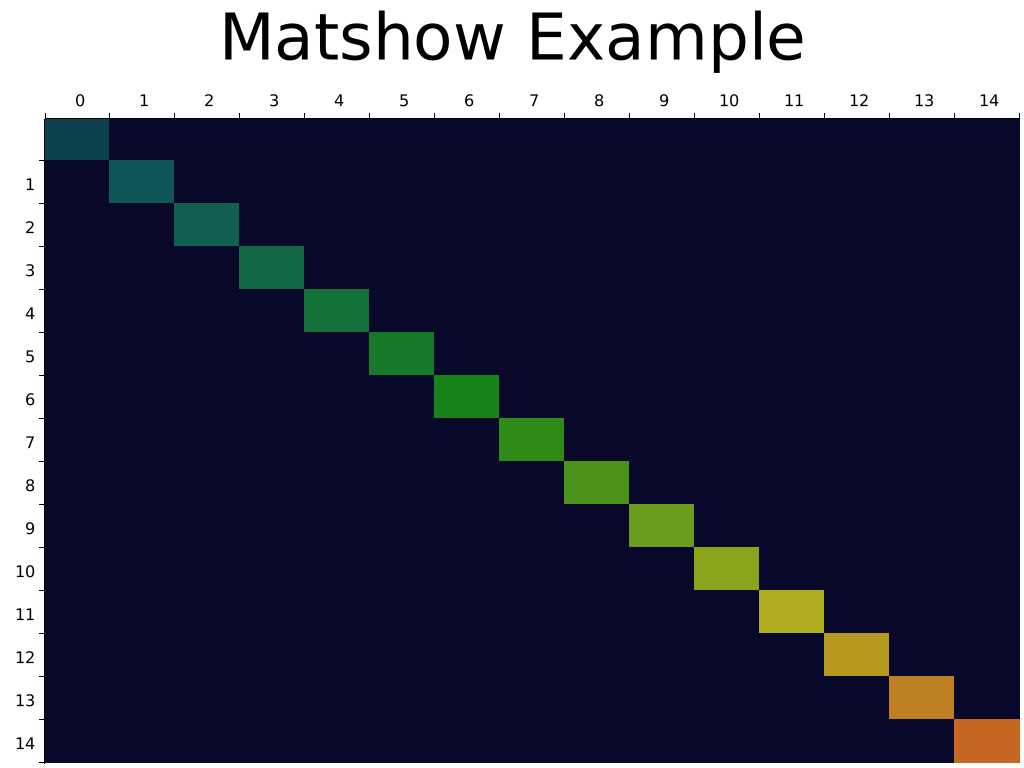
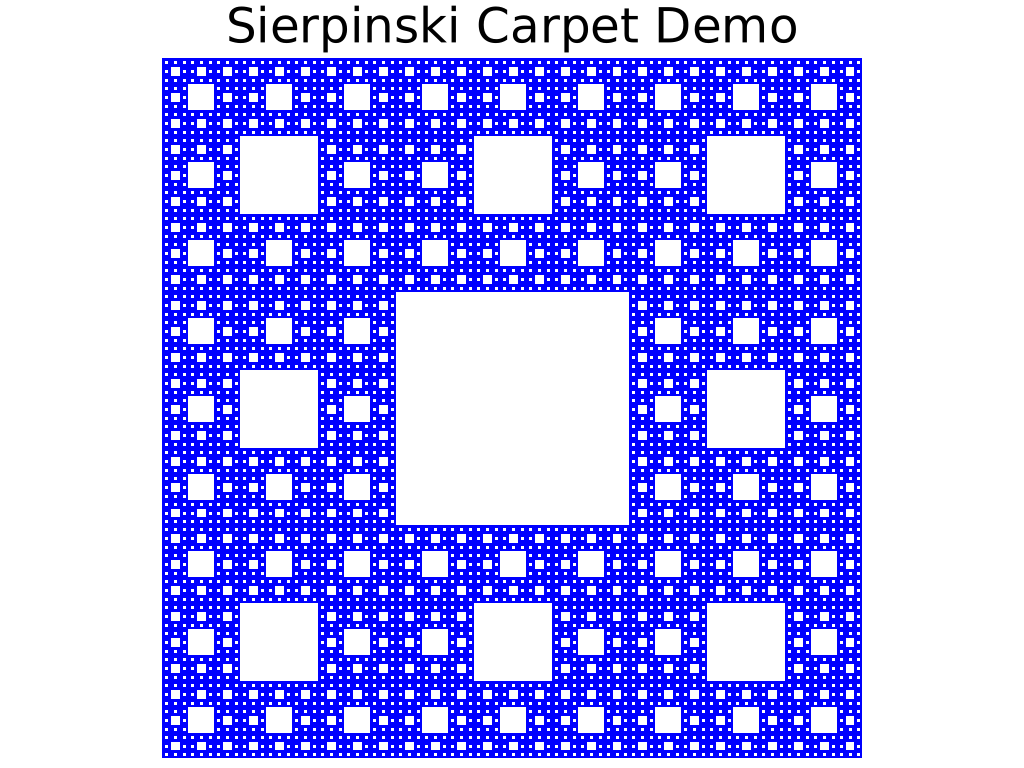
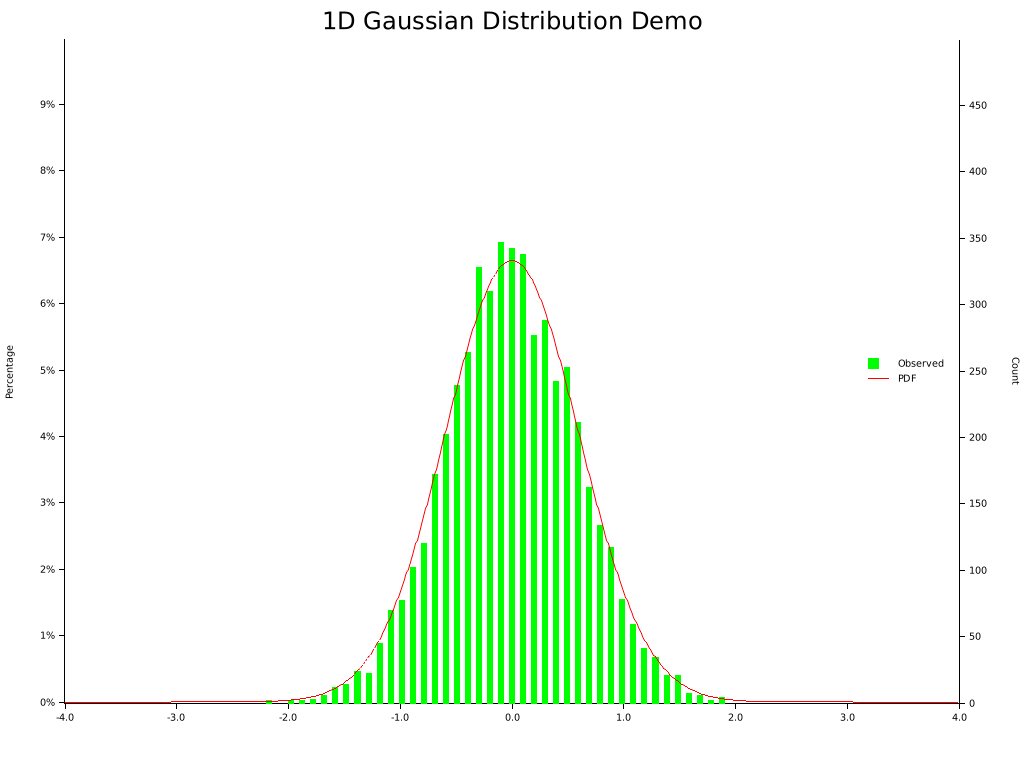
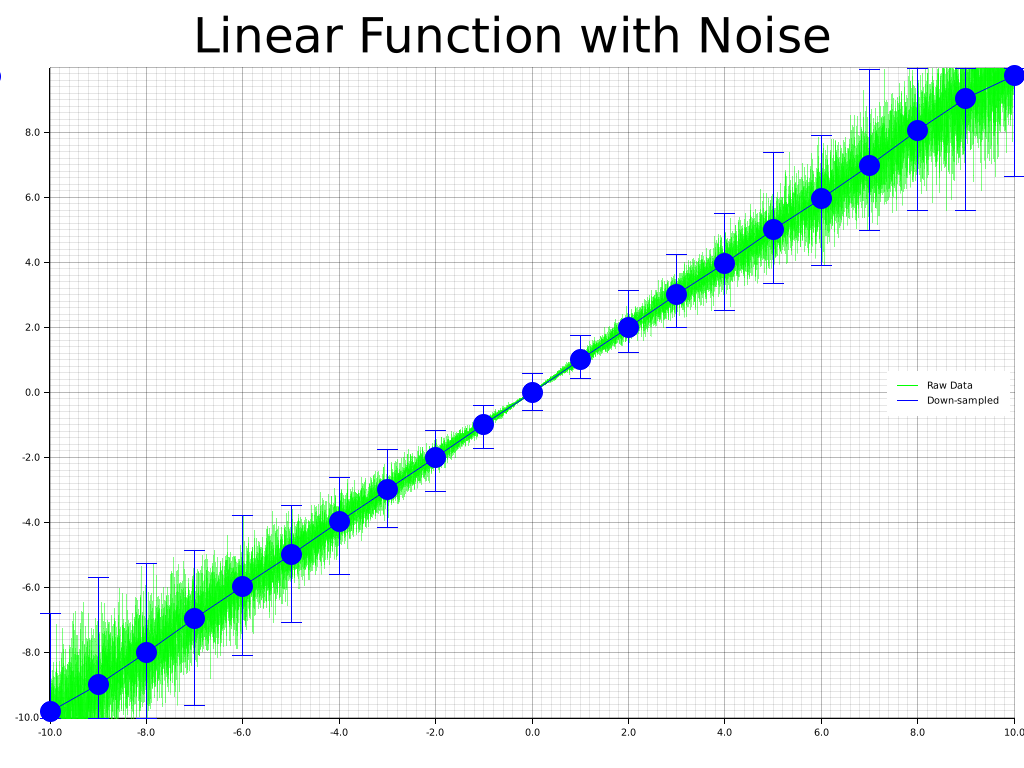
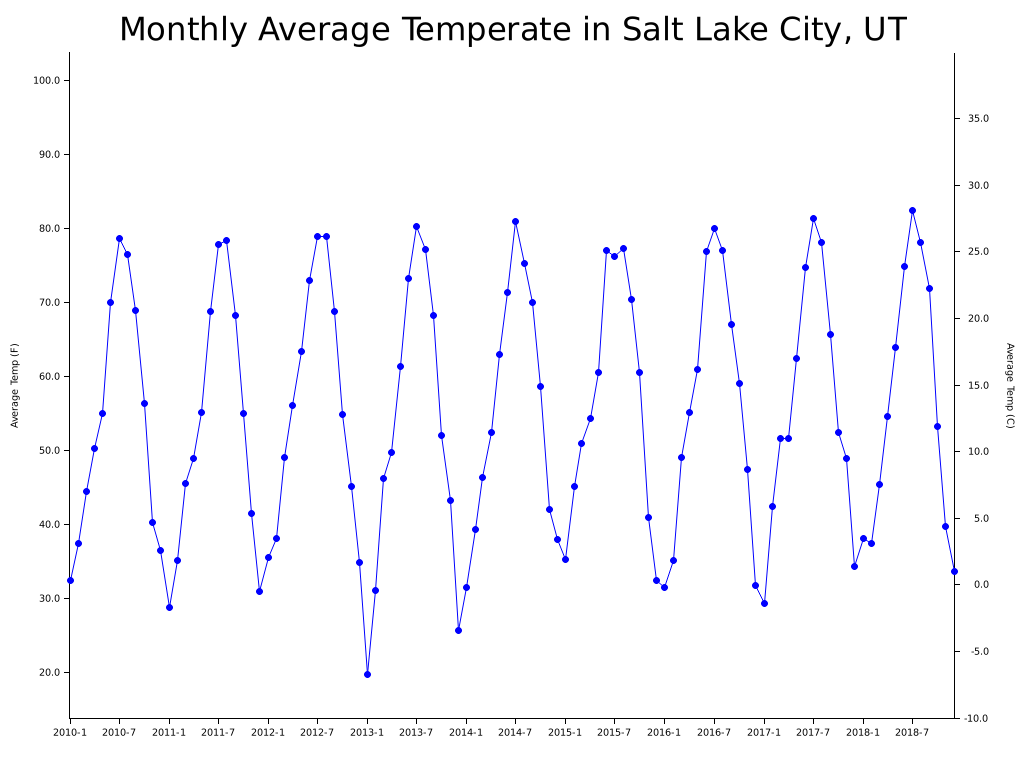
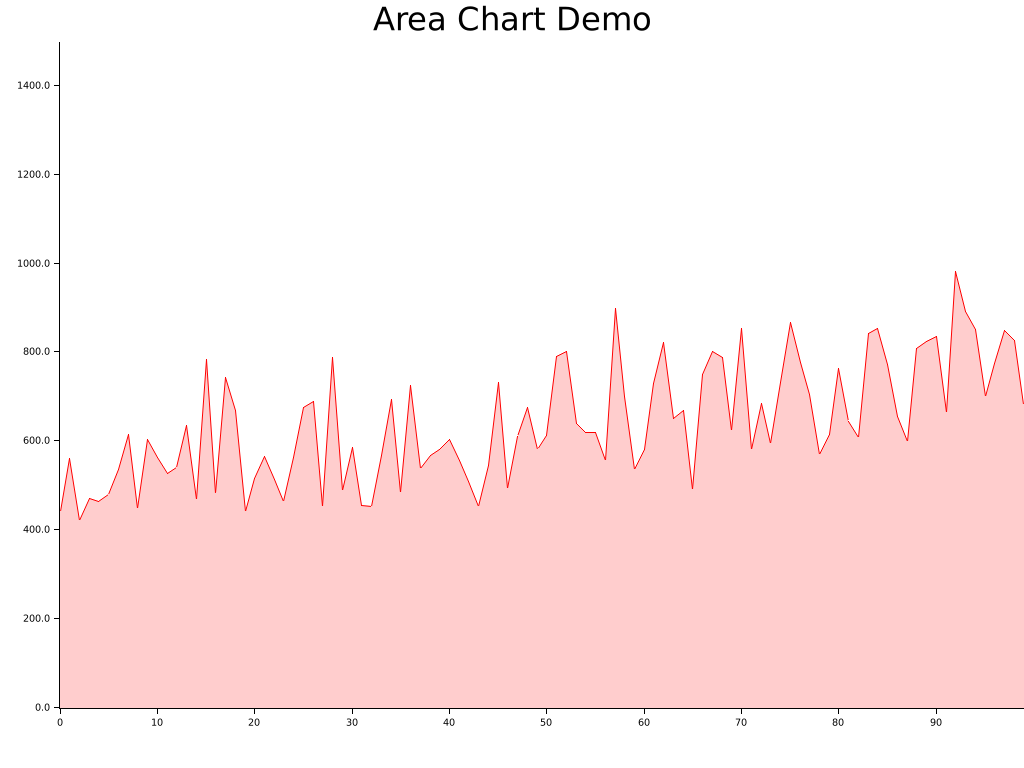
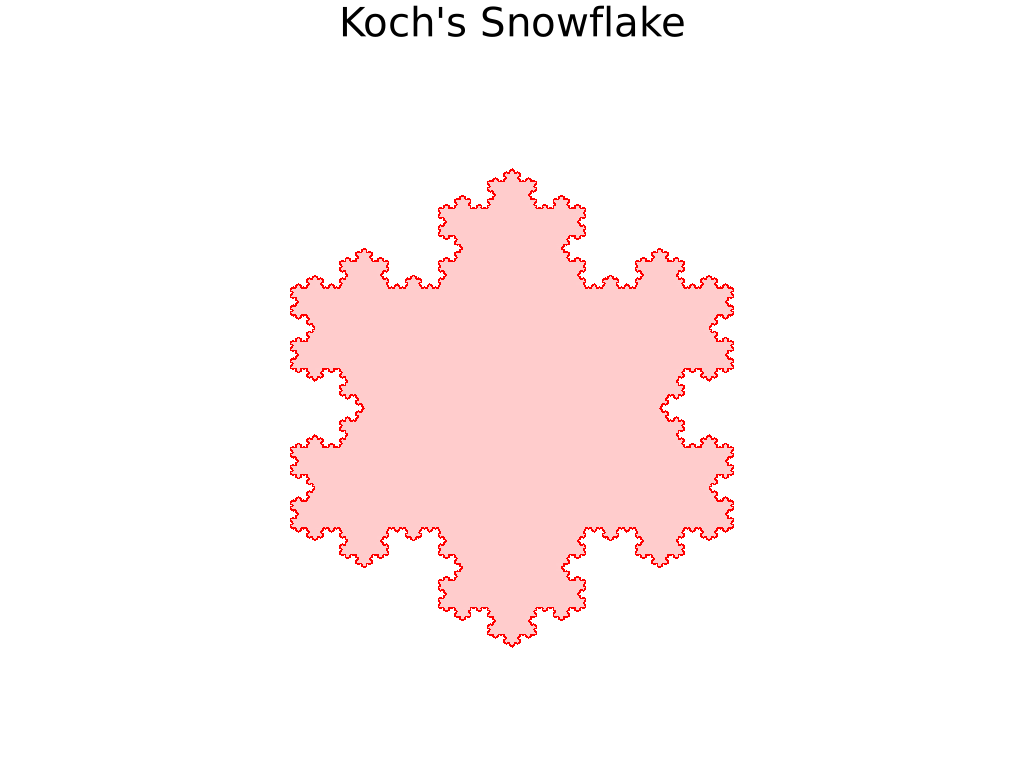
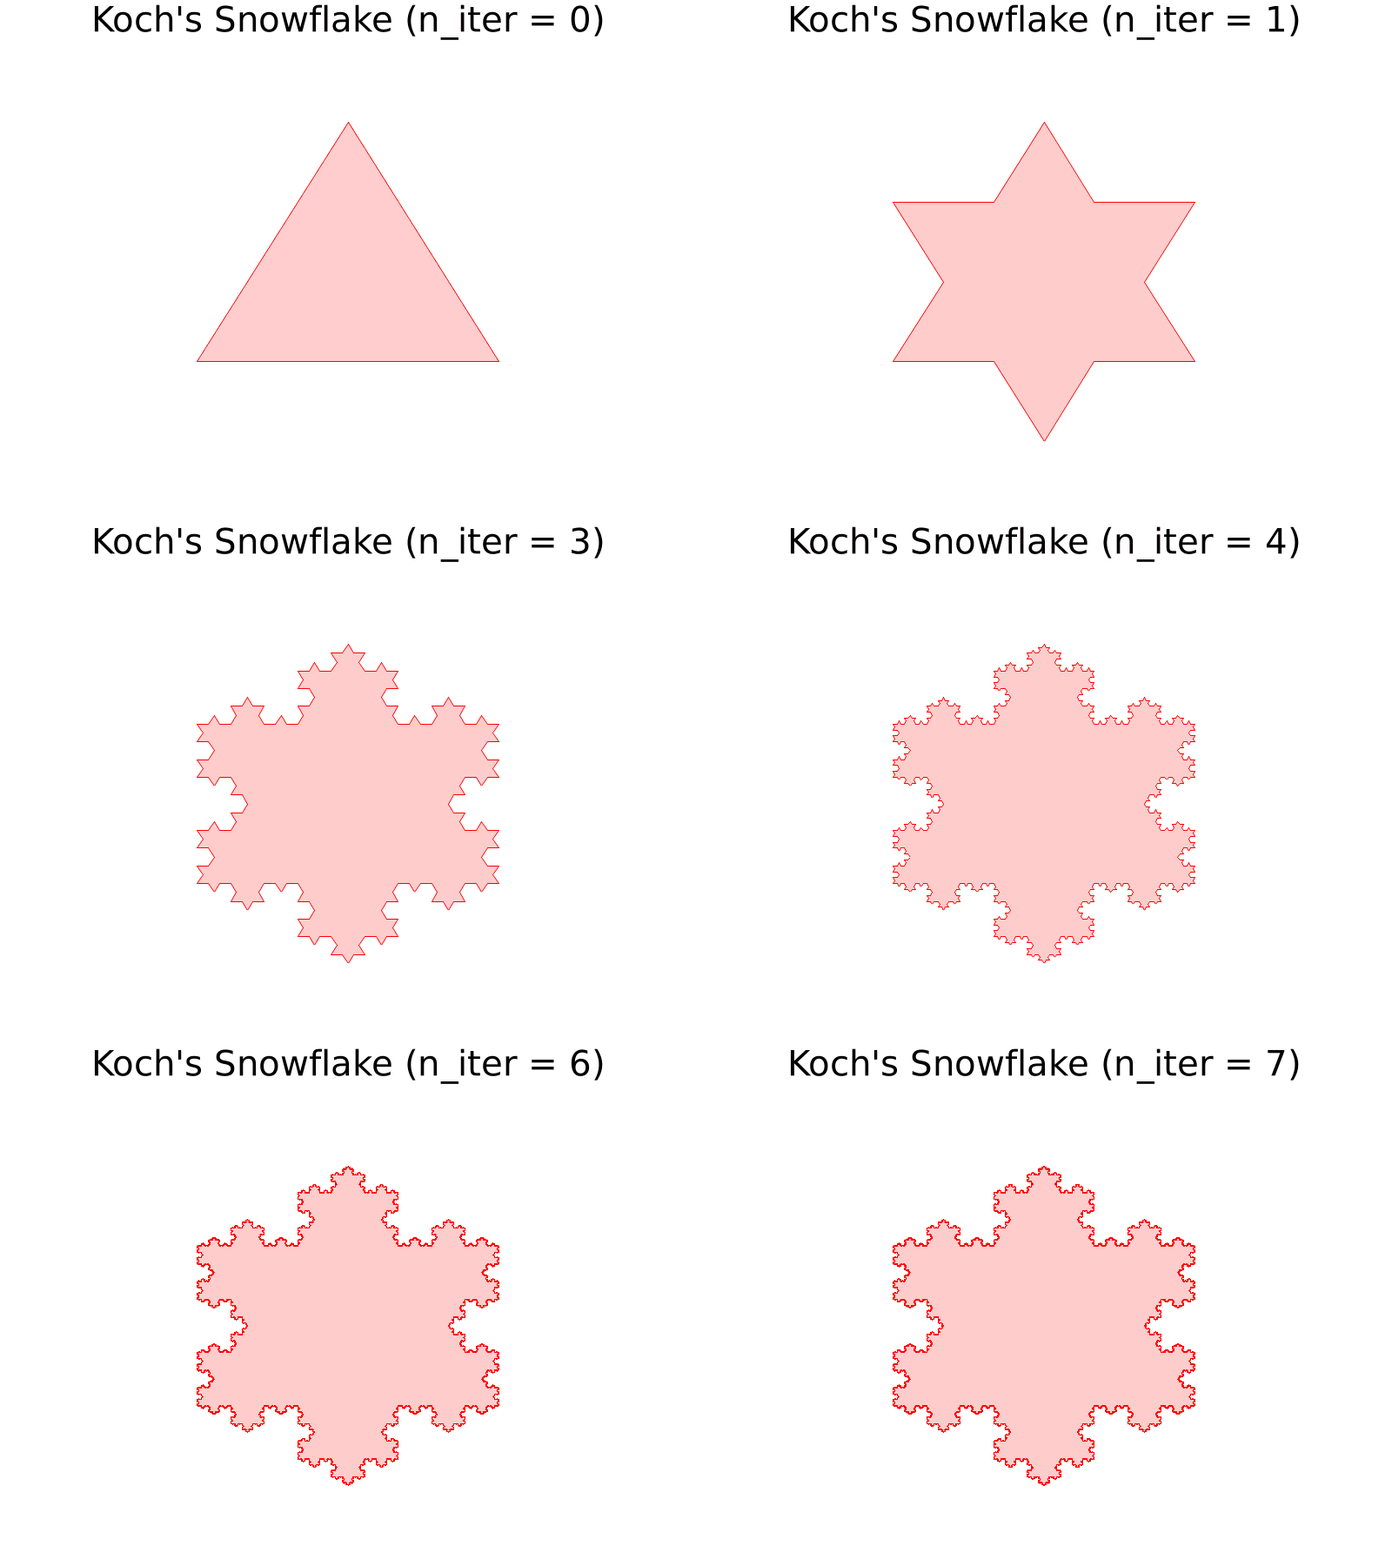
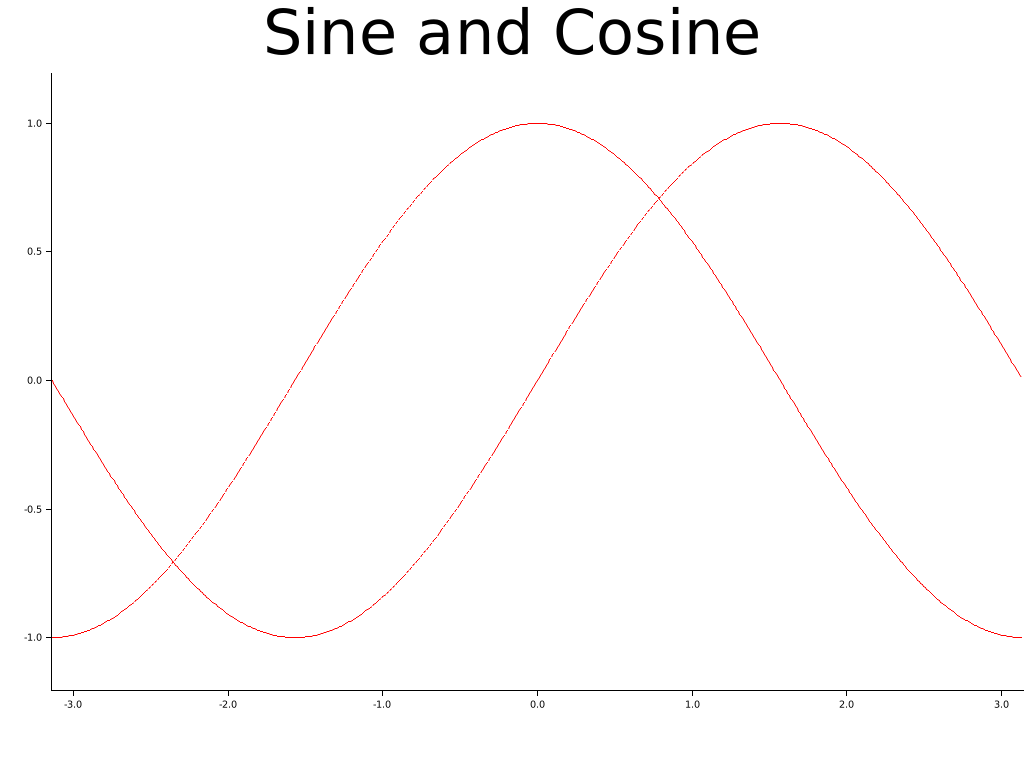
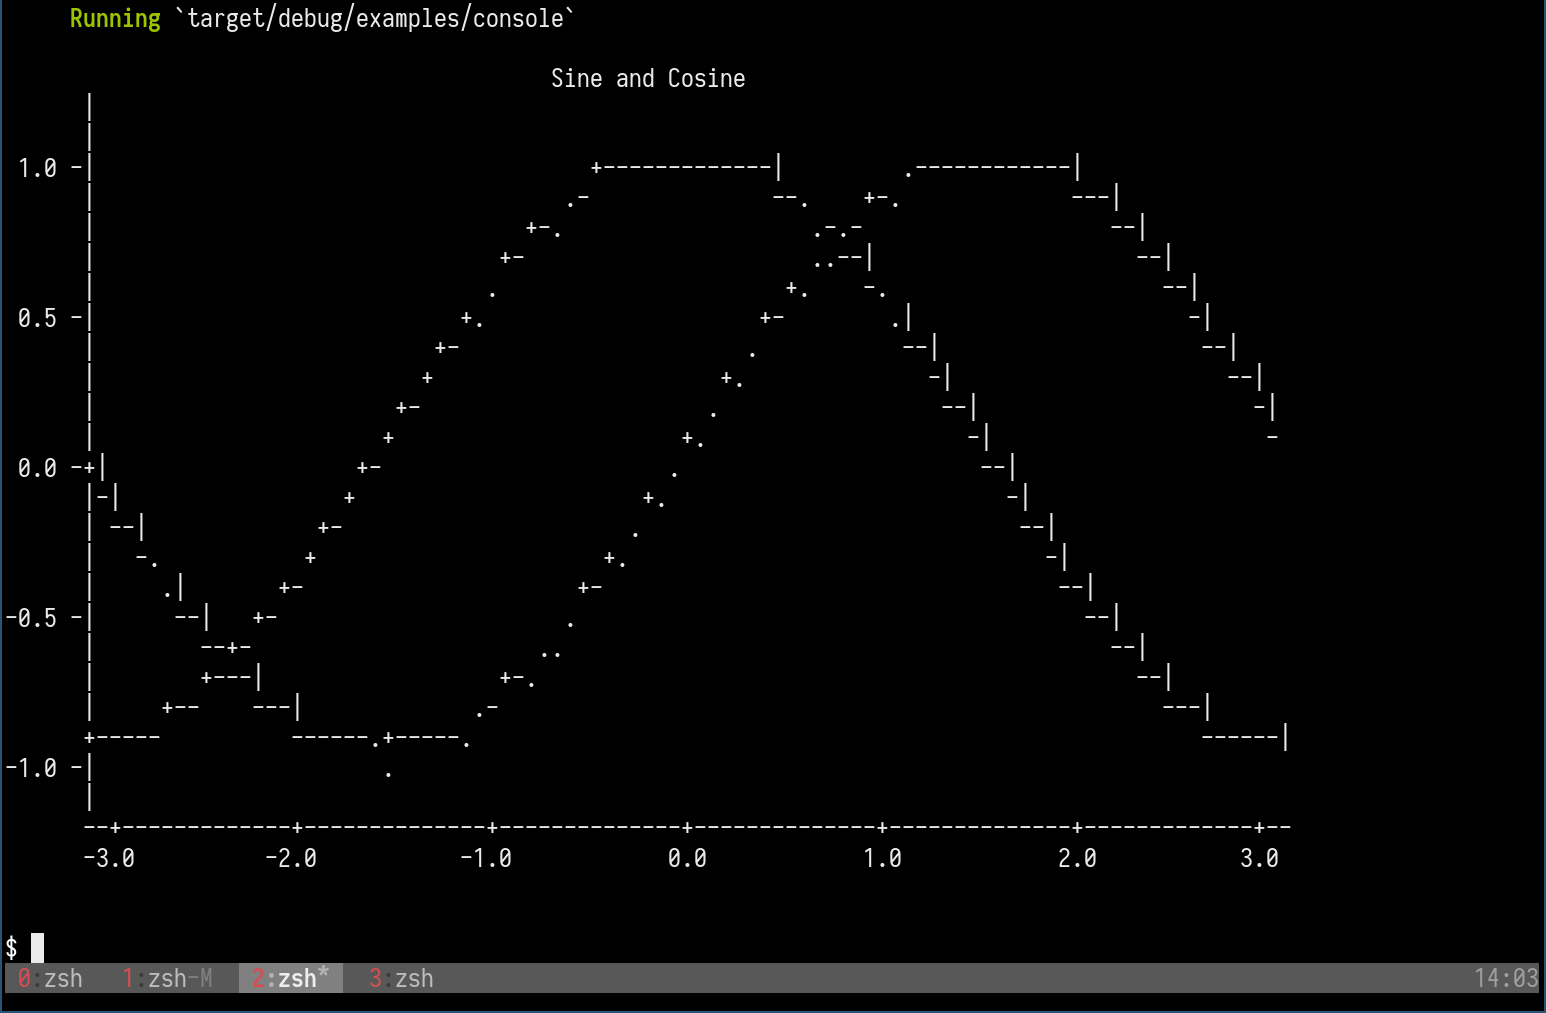
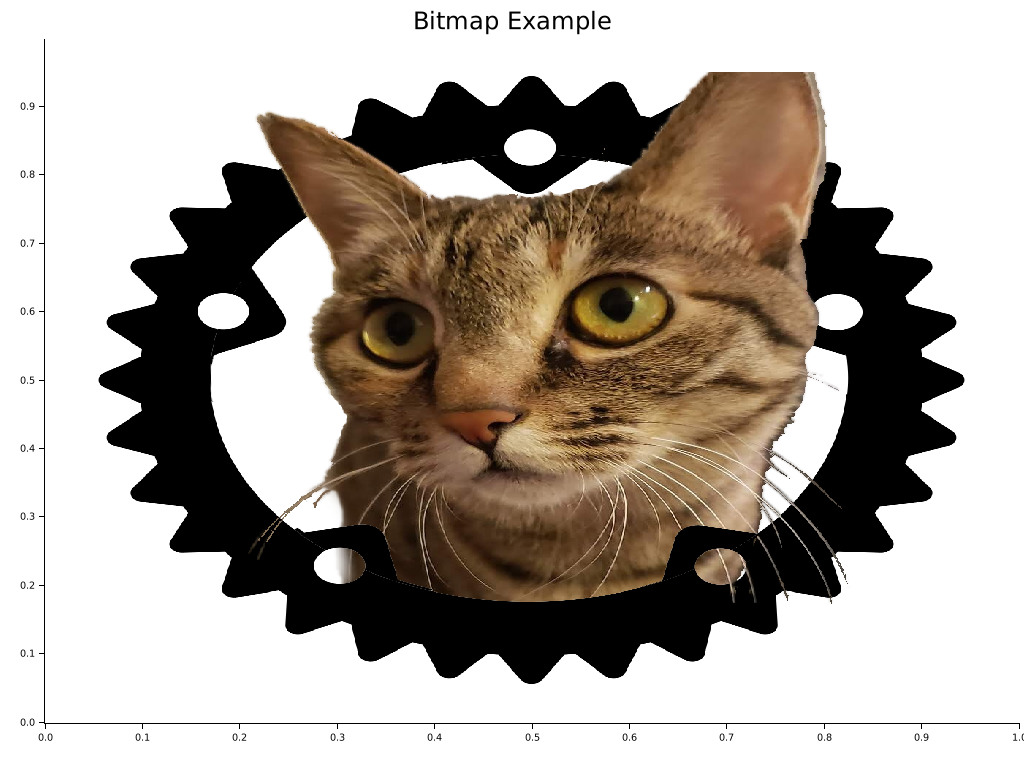
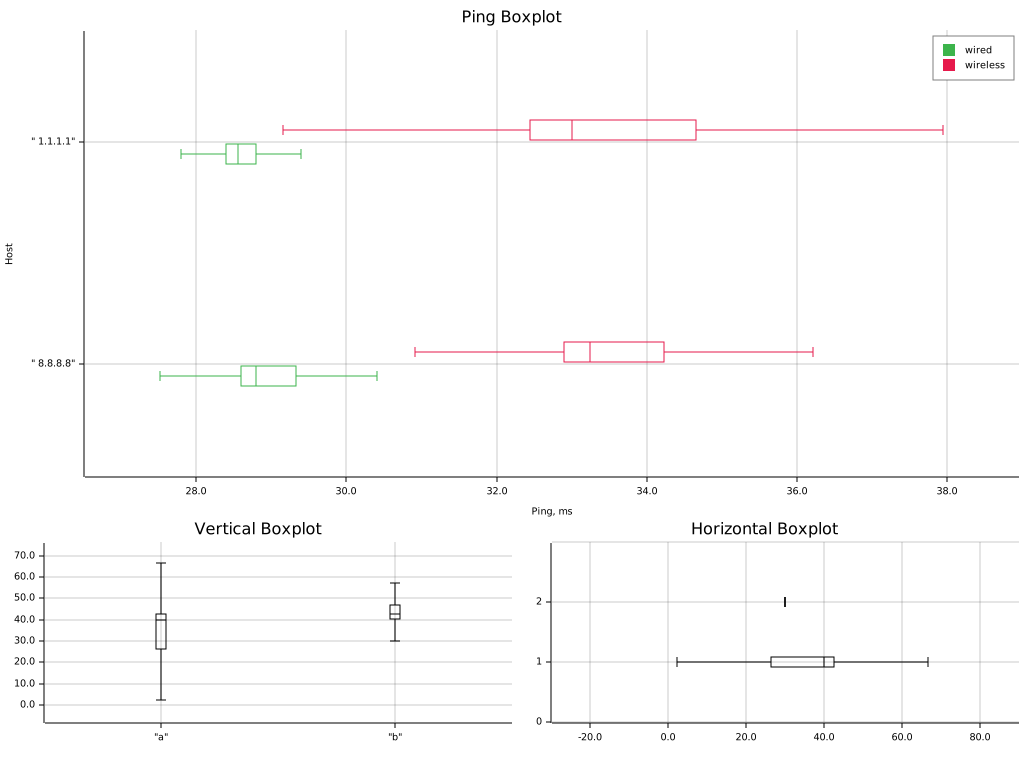
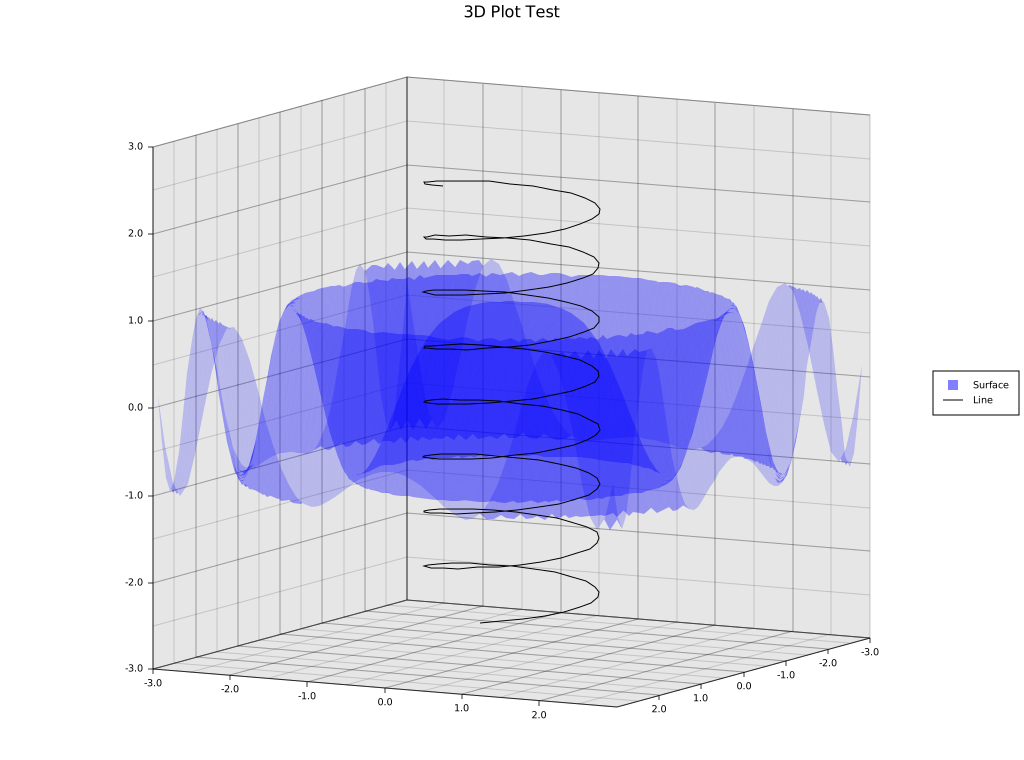
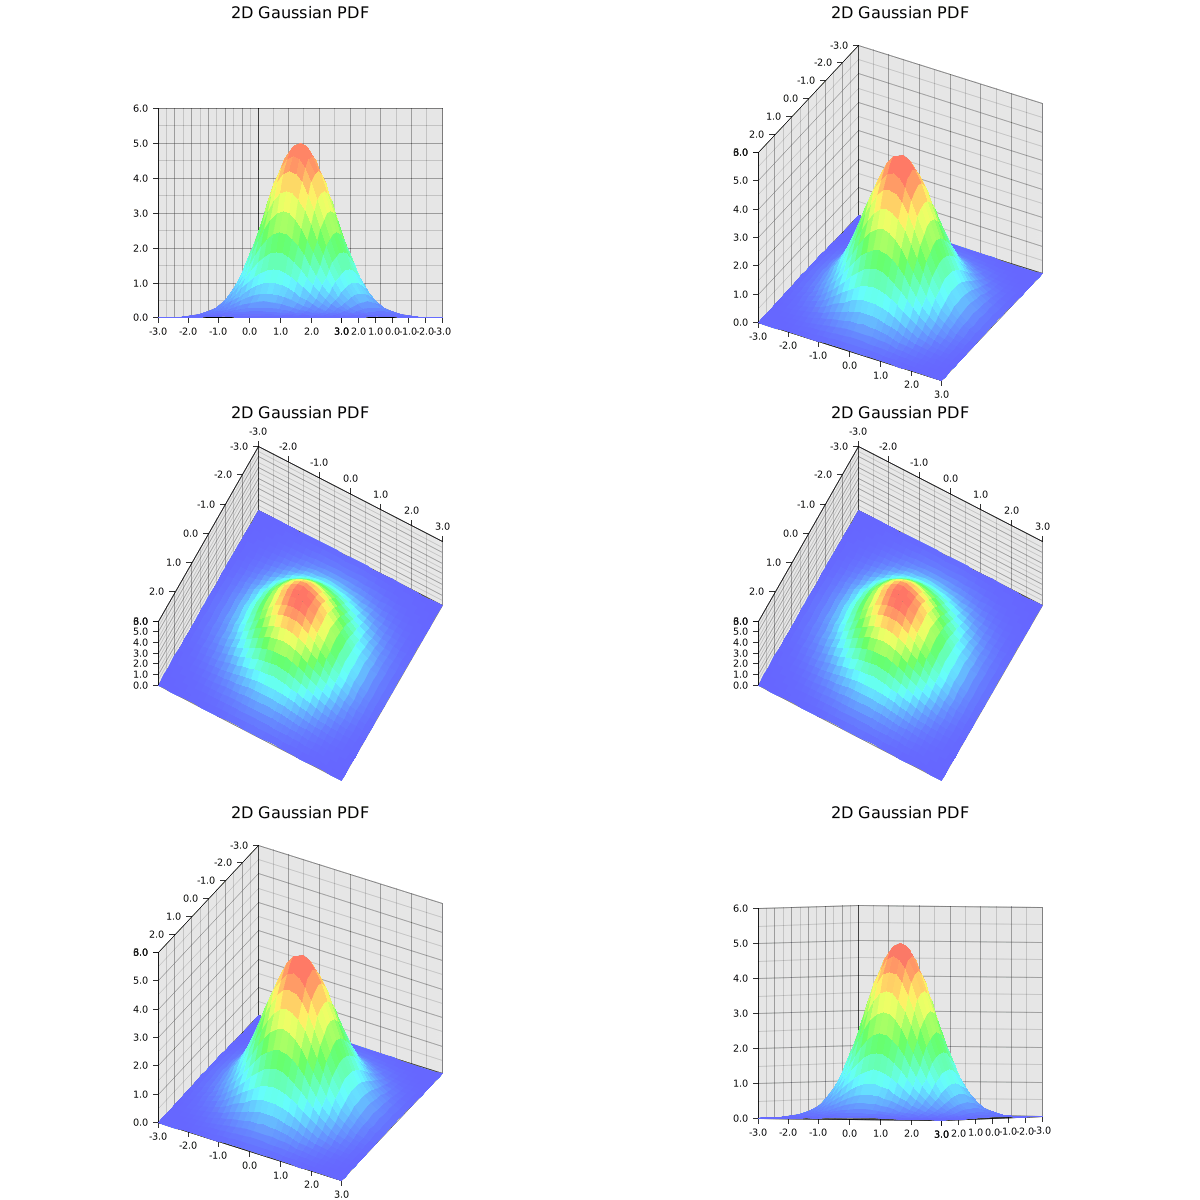
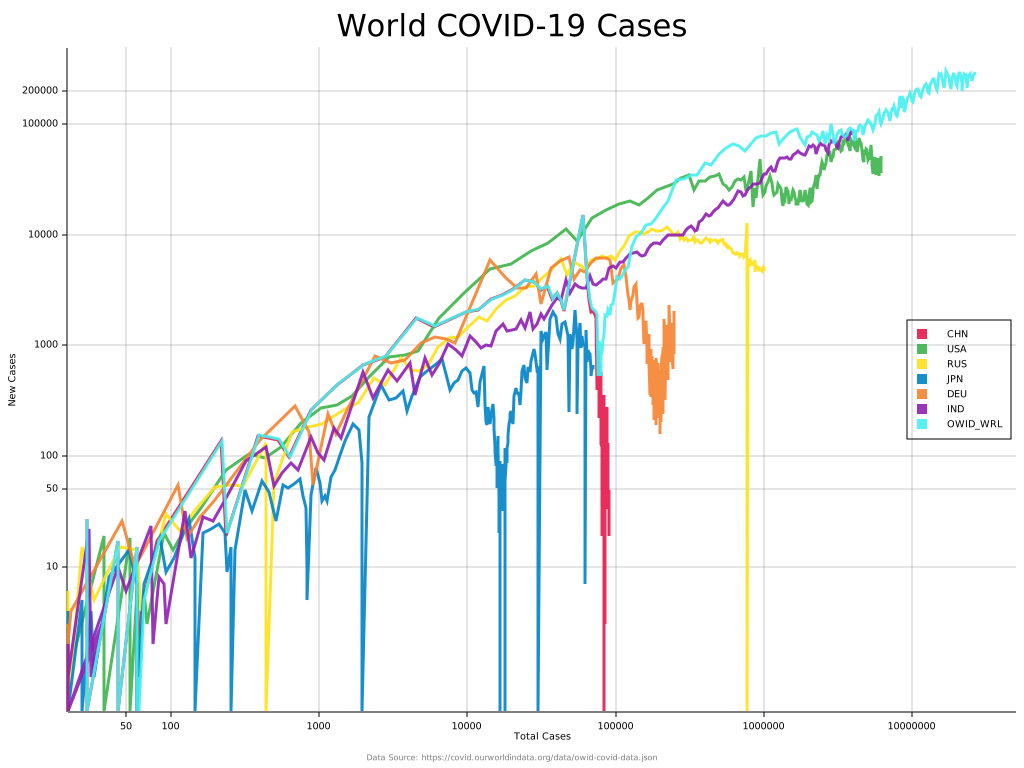
Table of Contents
- Gallery
- Dependencies
- Quick Start
- Demo Projects
- Trying with Jupyter evcxr Kernel Interactively
- Interactive Tutorial with Jupyter Notebook
- Plotting in Rust
- Plotting on HTML5 canvas with WASM Backend
- What types of figure are supported?
- Concepts by example
- Misc
- FAQ List
Dependencies
Ubuntu Linux
sudo apt install pkg-config libfreetype6-dev libfontconfig1-dev
Fedora Linux
sudo dnf install pkgconf freetype-devel fontconfig-devel
Quick Start
To use Plotters, you can simply add Plotters into your Cargo.toml
[dependencies]
plotters = "0.3.3"
Create the subdirectory <Cargo project dir>/plotters-doc-data
And the following code draws a quadratic function. src/main.rs writes the chart to plotters-doc-data/0.png
use plotters::prelude::*;
fn main() -> Result<(), Box<dyn std::error::Error>> {
    let root = BitMapBackend::new("plotters-doc-data/0.png", (640, 480)).into_drawing_area();
    root.fill(&WHITE)?;
    let mut chart = ChartBuilder::on(&root)
        .caption("y=x^2", ("sans-serif", 50).into_font())
        .margin(5)
        .x_label_area_size(30)
        .y_label_area_size(30)
        .build_cartesian_2d(-1f32..1f32, -0.1f32..1f32)?;

    chart.configure_mesh().draw()?;

    chart
        .draw_series(LineSeries::new(
            (-50..=50).map(|x| x as f32 / 50.0).map(|x| (x, x * x)),
            &RED,
        ))?
        .label("y = x^2")
        .legend(|(x, y)| PathElement::new(vec![(x, y), (x + 20, y)], &RED));

    chart
        .configure_series_labels()
        .background_style(&WHITE.mix(0.8))
        .border_style(&BLACK)
        .draw()?;

    root.present()?;

    Ok(())
}
Demo Projects
To learn how to use Plotters in different scenarios, check out the following demo projects:
- WebAssembly + Plotters: plotters-wasm-demo
- minifb + Plotters: plotters-minifb-demo
- GTK + Plotters: plotters-gtk-demo
Trying with Jupyter evcxr Kernel Interactively
Plotters now supports integration with evcxr and is able to interactively draw plots in Jupyter Notebook.
The feature evcxr should be enabled when including Plotters to Jupyter Notebook.
The following code shows a minimal example of this.
:dep plotters = { version = "^0.3.6", default-features = false, features = ["evcxr", "all_series", "all_elements"] }
extern crate plotters;
use plotters::prelude::*;

let figure = evcxr_figure((640, 480), |root| {
    root.fill(&WHITE)?;
    let mut chart = ChartBuilder::on(&root)
        .caption("y=x^2", ("Arial", 50).into_font())
        .margin(5)
        .x_label_area_size(30)
        .y_label_area_size(30)
        .build_cartesian_2d(-1f32..1f32, -0.1f32..1f32)?;

    chart.configure_mesh().draw()?;

    chart.draw_series(LineSeries::new(
        (-50..=50).map(|x| x as f32 / 50.0).map(|x| (x, x * x)),
        &RED,
    )).unwrap()
        .label("y = x^2")
        .legend(|(x,y)| PathElement::new(vec![(x,y), (x + 20,y)], &RED));

    chart.configure_series_labels()
        .background_style(&WHITE.mix(0.8))
        .border_style(&BLACK)
        .draw()?;
    Ok(())
});
figure
Interactive Tutorial with Jupyter Notebook
This tutorial is a work in progress and isn't complete
Thanks to the evcxr, now we have an interactive tutorial for Plotters! To use the interactive notebook, you must have Jupyter and evcxr installed on your computer. Follow the instruction on this page below to install it.
After that, you should be able to start your Jupyter server locally and load the tutorial!
git clone https://github.com/38/plotters-doc-data
cd plotters-doc-data
jupyter notebook
And select the notebook called evcxr-jupyter-integration.ipynb.
Also, there's a static HTML version of this notebook available at this location
Plotting in Rust
Rust is a perfect language for data visualization. Although there are many mature visualization libraries in many different languages, Rust is one of the best languages that fits the need.
Easy to use Rust has a very good iterator system built into the standard library. With the help of iterators, plotting in Rust can be as easy as most of the high-level programming languages. The Rust based plotting library can be very easy to use.
Fast If you need to render a figure with trillions of data points, Rust is a good choice. Rust's performance allows you to combine the data processing step and rendering step into a single application. When plotting in high-level programming languages, e.g. Javascript or Python, data points must be down-sampled before feeding into the plotting program because of the performance considerations. Rust is fast enough to do the data processing and visualization within a single program. You can also integrate the figure rendering code into your application to handle a huge amount of data and visualize it in real-time.
WebAssembly Support Rust is one of the languages with the best WASM support. Plotting in Rust could be very useful for visualization on a web page and would have a huge performance improvement comparing to Javascript.
Plotting on HTML5 canvas with WASM Backend
Plotters currently supports a backend that uses the HTML5 canvas. To use WASM, you can simply use
CanvasBackend instead of other backend and all other API remains the same!
There's a small demo for Plotters + WASM available at here. To play with the deployed version, follow this link.
What types of figure are supported?
Plotters is not limited to any specific type of figure. You can create your own types of figures easily with the Plotters API.
Plotters does provide some built-in figure types for convenience. Currently, we support line series, point series, candlestick series, and histogram. And the library is designed to be able to render multiple figure into a single image. But Plotter is aimed to be a platform that is fully extendable to support any other types of figure.
Concepts by example
Drawing Backends
Plotters can use different drawing backends, including SVG, BitMap, and even real-time rendering. For example, a bitmap drawing backend.
use plotters::prelude::*;
fn main() -> Result<(), Box<dyn std::error::Error>> {
    // Create a 800*600 bitmap and start drawing
    let mut backend = BitMapBackend::new("plotters-doc-data/1.png", (300, 200));
    // And if we want SVG backend
    // let mut backend = SVGBackend::new("output.svg", (800, 600));
    backend.draw_rect((50, 50), (200, 150), &RED, true)?;
    backend.present()?;
    Ok(())
}

Drawing Area
Plotters uses a concept called drawing area for layout purpose. Plotters supports integrating multiple figures into a single image. This is done by creating sub-drawing-areas.
Besides that, the drawing area also allows for a customized coordinate system, by doing so, the coordinate mapping is done by the drawing area automatically.
use plotters::prelude::*;
fn main() -> Result<(), Box<dyn std::error::Error>> {
    let root_drawing_area =
        BitMapBackend::new("plotters-doc-data/2.png", (300, 200)).into_drawing_area();
    // And we can split the drawing area into 3x3 grid
    let child_drawing_areas = root_drawing_area.split_evenly((3, 3));
    // Then we fill the drawing area with different color
    for (area, color) in child_drawing_areas.into_iter().zip(0..) {
        area.fill(&Palette99::pick(color))?;
    }
    root_drawing_area.present()?;
    Ok(())
}

Elements
In Plotters, elements are the building blocks of figures. All elements are able to be drawn on a drawing area. There are different types of built-in elements, like lines, texts, circles, etc. You can also define your own element in the application code.
You may also combine existing elements to build a complex element.
To learn more about the element system, please read the element module documentation.
use plotters::prelude::*;
fn main() -> Result<(), Box<dyn std::error::Error>> {
    let root = BitMapBackend::new("plotters-doc-data/3.png", (300, 200)).into_drawing_area();
    root.fill(&WHITE)?;
    // Draw an circle on the drawing area
    root.draw(&Circle::new(
        (100, 100),
        50,
        Into::<ShapeStyle>::into(&GREEN).filled(),
    ))?;
    root.present()?;
    Ok(())
}

Composable Elements
Besides the built-in elements, elements can be composed into a logical group we called composed elements.
When composing new elements, the upper-left corner is given in the target coordinate, and a new pixel-based
coordinate which has the upper-left corner defined as (0,0) is used for further element composition.
For example, we can have an element which includes a dot and its coordinate.
use plotters::prelude::*;
use plotters::coord::types::RangedCoordf32;

fn main() -> Result<(), Box<dyn std::error::Error>> {
    let root = BitMapBackend::new("plotters-doc-data/4.png", (640, 480)).into_drawing_area();

    root.fill(&RGBColor(240, 200, 200))?;

    let root = root.apply_coord_spec(Cartesian2d::<RangedCoordf32, RangedCoordf32>::new(
        0f32..1f32,
        0f32..1f32,
        (0..640, 0..480),
    ));

    let dot_and_label = |x: f32, y: f32| {
        return EmptyElement::at((x, y))
            + Circle::new((0, 0), 3, ShapeStyle::from(&BLACK).filled())
            + Text::new(
                format!("({:.2},{:.2})", x, y),
                (10, 0),
                ("sans-serif", 15.0).into_font(),
            );
    };

    root.draw(&dot_and_label(0.5, 0.6))?;
    root.draw(&dot_and_label(0.25, 0.33))?;
    root.draw(&dot_and_label(0.8, 0.8))?;
    root.present()?;
    Ok(())
}
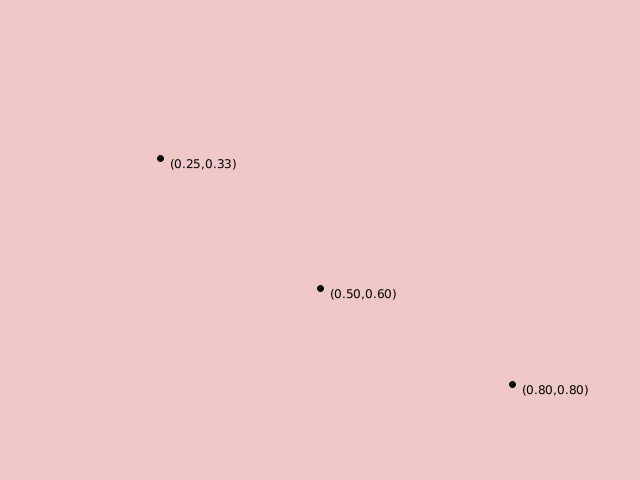
Chart Context
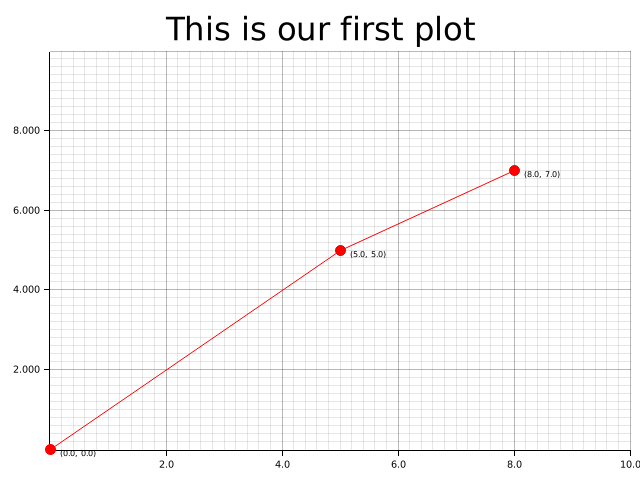
In order to draw a chart, Plotters needs a data object built on top of the drawing area called ChartContext.
The chart context defines even higher level constructs compare to the drawing area.
For example, you can define the label areas, meshes, and put a data series onto the drawing area with the help
of the chart context object.
use plotters::prelude::*;
fn main() -> Result<(), Box<dyn std::error::Error>> {
    let root = BitMapBackend::new("plotters-doc-data/5.png", (640, 480)).into_drawing_area();
    root.fill(&WHITE);
    let root = root.margin(10, 10, 10, 10);
    // After this point, we should be able to construct a chart context
    let mut chart = ChartBuilder::on(&root)
        // Set the caption of the chart
        .caption("This is our first plot", ("sans-serif", 40).into_font())
        // Set the size of the label region
        .x_label_area_size(20)
        .y_label_area_size(40)
        // Finally attach a coordinate on the drawing area and make a chart context
        .build_cartesian_2d(0f32..10f32, 0f32..10f32)?;

    // Then we can draw a mesh
    chart
        .configure_mesh()
        // We can customize the maximum number of labels allowed for each axis
        .x_labels(5)
        .y_labels(5)
        // We can also change the format of the label text
        .y_label_formatter(&|x| format!("{:.3}", x))
        .draw()?;

    // And we can draw something in the drawing area
    chart.draw_series(LineSeries::new(
        vec![(0.0, 0.0), (5.0, 5.0), (8.0, 7.0)],
        &RED,
    ))?;
    // Similarly, we can draw point series
    chart.draw_series(PointSeries::of_element(
        vec![(0.0, 0.0), (5.0, 5.0), (8.0, 7.0)],
        5,
        &RED,
        &|c, s, st| {
            return EmptyElement::at(c)    // We want to construct a composed element on-the-fly
            + Circle::new((0,0),s,st.filled()) // At this point, the new pixel coordinate is established
            + Text::new(format!("{:?}", c), (10, 0), ("sans-serif", 10).into_font());
        },
    ))?;
    root.present()?;
    Ok(())
}
Misc
Development Version
Find the latest development version of Plotters on GitHub. Clone the repository and learn more about the Plotters API and ways to contribute. Your help is needed!
If you want to add the development version of Plotters to your project, add the following to your Cargo.toml:
[dependencies]
plotters = { git = "https://github.com/plotters-rs/plotters.git" }
Reducing Depending Libraries && Turning Off Backends
Plotters now supports use features to control the backend dependencies. By default, BitMapBackend and SVGBackend are supported,
use default-features = false in the dependency description in Cargo.toml and you can cherry-pick the backend implementations.
svgEnable theSVGBackendbitmapEnable theBitMapBackend
For example, the following dependency description would avoid compiling with bitmap support:
[dependencies]
plotters = { git = "https://github.com/plotters-rs/plotters.git", default-features = false, features = ["svg"] }
The library also allows consumers to make use of the Palette crate's color types by default.
This behavior can also be turned off by setting default-features = false.
List of Features
This is the full list of features that is defined by Plotters crate.
Use default-features = false to disable those default enabled features,
and then you should be able to cherry-pick what features you want to include into Plotters crate.
By doing so, you can minimize the number of dependencies down to only itertools and compile time is less than 6s.
The following list is a complete list of features that can be opted in or out.
- Tier 1 drawing backends
| Name | Description | Additional Dependency | Default? |
|---|---|---|---|
| bitmap_encoder | Allow BitMapBackend to save the result to bitmap files |
image, rusttype, font-kit | Yes |
| svg_backend | Enable SVGBackend Support |
None | Yes |
| bitmap_gif | Opt-in GIF animation Rendering support for BitMapBackend, implies bitmap enabled |
gif | Yes |
- Font manipulation features
| Name | Description | Additional Dependency | Default? |
|---|---|---|---|
| ttf | Allows TrueType font support | font-kit | Yes |
| ab_glyph | Skips loading system fonts, unlike ttf |
ab_glyph | No |
ab_glyph supports TrueType and OpenType fonts, but does not attempt to
load fonts provided by the system on which it is running.
It is pure Rust, and easier to cross compile.
To use this, you must call plotters::style::register_font before
using any plotters functions which require the ability to render text.
This function only exists when the ab_glyph feature is enabled.
/// Register a font in the fonts table.
///
/// The `name` parameter gives the name this font shall be referred to
/// in the other APIs, like `"sans-serif"`.
///
/// Unprovided font styles for a given name will fallback to `FontStyle::Normal`
/// if that is available for that name, when other functions lookup fonts which
/// are registered with this function.
///
/// The `bytes` parameter should be the complete contents
/// of an OpenType font file, like:
/// ```ignore
/// include_bytes!("FiraGO-Regular.otf")
/// ```
pub fn register_font(
    name: &str,
    style: FontStyle,
    bytes: &'static [u8],
) -> Result<(), InvalidFont>
- (De)serialization features
| Name | Description | Additional Dependency | Default? |
|---|---|---|---|
| serialization | Enables serde (de)serialization support | serde | No |
serialization enables support for serializing and deserializing using the serde crate.
Enable the feature via Cargo.toml then use it like the following:
#[cfg(feature = "serialization")]
use serde::{Deserialize, Serialize};

#[cfg_attr(feature = "serialization", derive(Serialize, Deserialize))]
pub struct RGBAColor(pub u8, pub u8, pub u8, pub f64);
- Coordinate features
| Name | Description | Additional Dependency | Default? |
|---|---|---|---|
| datetime | Enable the date and time coordinate support | chrono | Yes |
- Element, series and util functions
| Name | Description | Additional Dependency | Default? |
|---|---|---|---|
| errorbar | The errorbar element support | None | Yes |
| candlestick | The candlestick element support | None | Yes |
| boxplot | The boxplot element support | None | Yes |
| area_series | The area series support | None | Yes |
| line_series | The line series support | None | Yes |
| histogram | The histogram series support | None | Yes |
| point_series | The point series support | None | Yes |
- Misc
| Name | Description | Additional Dependency | Default? |
|---|---|---|---|
| deprecated_items | This feature allows use of deprecated items which is going to be removed in the future | None | Yes |
| debug | Enable the code used for debugging | None | No |
FAQ List
Why does the WASM example break on my machine ?
The WASM example requires using
wasm32target to build. Usingcargo buildis likely to use the default target which in most of the case is any of the x86 target. Thus you need add--target=wasm32-unknown-unknownin the cargo parameter list to build it.How to draw text/circle/point/rectangle/... on the top of chart ?
As you may have realized, Plotters is a drawing library rather than a traditional data plotting library, you have the freedom to draw anything you want on the drawing area. Use
DrawingArea::drawto draw any element on the drawing area.Where can I find the backend code ?
Since Plotters 0.3, all drawing backends are independent crate from the main Plotters crate. Use the following link to find the backend code:
- Bitmap Backend (current repository)
- SVG Backend (current repository)
- HTML5 Canvas Backend
- GTK/Cairo Backend
How to check if a backend writes to a file successfully ?
The behavior of Plotters backend is consistent with the standard library. When the backend instance is dropped, [
crate::drawing::DrawingArea::present()] orBackend::present()is called automatically whenever is needed. When thepresent()method is called fromdrop, any error will be silently ignored.In the case that error handling is important, you need manually call the
present()method before the backend gets dropped. For more information, please see the examples.