The backtesting engine that gives you an unfair advantage. Run thousands of trading ideas before others finish one.
pip install vectorbt











Thinks in matrices, backtests at scale.
VectorBT takes a radically different approach to backtesting: instead of looping through bars one strategy at a time, it packs thousands of configurations into NumPy arrays, accelerates the hot path with Numba and Rust, and runs them all at once, turning hours of grid search into seconds.
Explore thousands of trading ideas across assets and timeframes, analyze portfolio performance down to individual trades, and visualize results interactively, all in a few lines of code. Built for both human researchers and AI agents, VectorBT combines large-scale experimentation with a mature, battle-tested backtesting stack refined through years of community use.
VectorBT is the open-source community edition of VectorBT PRO, a state-of-the-art hybrid backtesting library.
Features
- Fast, vectorized backtesting and strategy research built on pandas, NumPy, and Numba
- Optional Rust engine for precompiled speed without JIT overhead
- Pandas-native API with custom accessors and high-performance operations
- Flexible broadcasting for multi-asset analysis and large-scale parameter sweeps
- Rich indicator ecosystem with custom indicators and integrations for TA-Lib, Pandas TA, and more
- Portfolio backtesting with trade, drawdown, and performance analytics, including QuantStats integration
- Signal tooling for generation, ranking, mapping, and distribution analysis
- Built-in data access with preprocessing and synthetic data generation
- Robustness testing with walk-forward optimization and label generation for ML workflows
- Interactive visualization with Plotly, Jupyter widgets, and browser-friendly dashboards
- Automation tools for scheduled updates and Telegram notifications
- Composable Python API for rapid experimentation and AI agent-driven workflows
Installation
pip install -U vectorbt
To install the optional Rust engine:
pip install -U "vectorbt[rust]"
To install all optional integrations (TA-Lib, Pandas TA, etc.):
pip install -U "vectorbt[full]"
To install all optional integrations together with the Rust engine:
pip install -U "vectorbt[full,rust]"
Examples
Invest $100 in Bitcoin since 2014
import vectorbt as vbt

data = vbt.YFData.download("BTC-USD")
price = data.get("Close")

pf = vbt.Portfolio.from_holding(price, init_cash=100)
print(pf.total_profit())
19501.10906763755
Trade a dual-SMA crossover strategy
fast_ma = vbt.MA.run(price, 10)
slow_ma = vbt.MA.run(price, 50)
entries = fast_ma.ma_crossed_above(slow_ma)
exits = fast_ma.ma_crossed_below(slow_ma)

pf = vbt.Portfolio.from_signals(price, entries, exits, init_cash=100)
print(pf.total_profit())
34417.80960086067
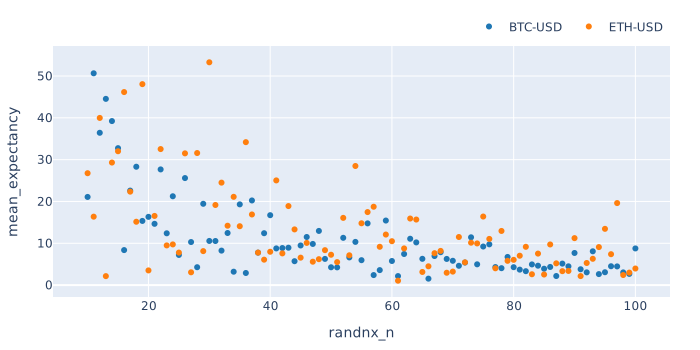
Generate 1,000 random strategies
import numpy as np

symbols = ["BTC-USD", "ETH-USD"]
data = vbt.YFData.download(symbols, missing_index="drop")
price = data.get("Close")

n = np.random.randint(10, 101, size=1000).tolist()
pf = vbt.Portfolio.from_random_signals(price, n=n, init_cash=100, seed=42)

mean_expectancy = pf.trades.expectancy().groupby(["randnx_n", "symbol"]).mean()
fig = mean_expectancy.unstack().vbt.scatterplot(xaxis_title="randnx_n", yaxis_title="mean_expectancy")
fig.show()
Test 10,000 dual-SMA window combinations
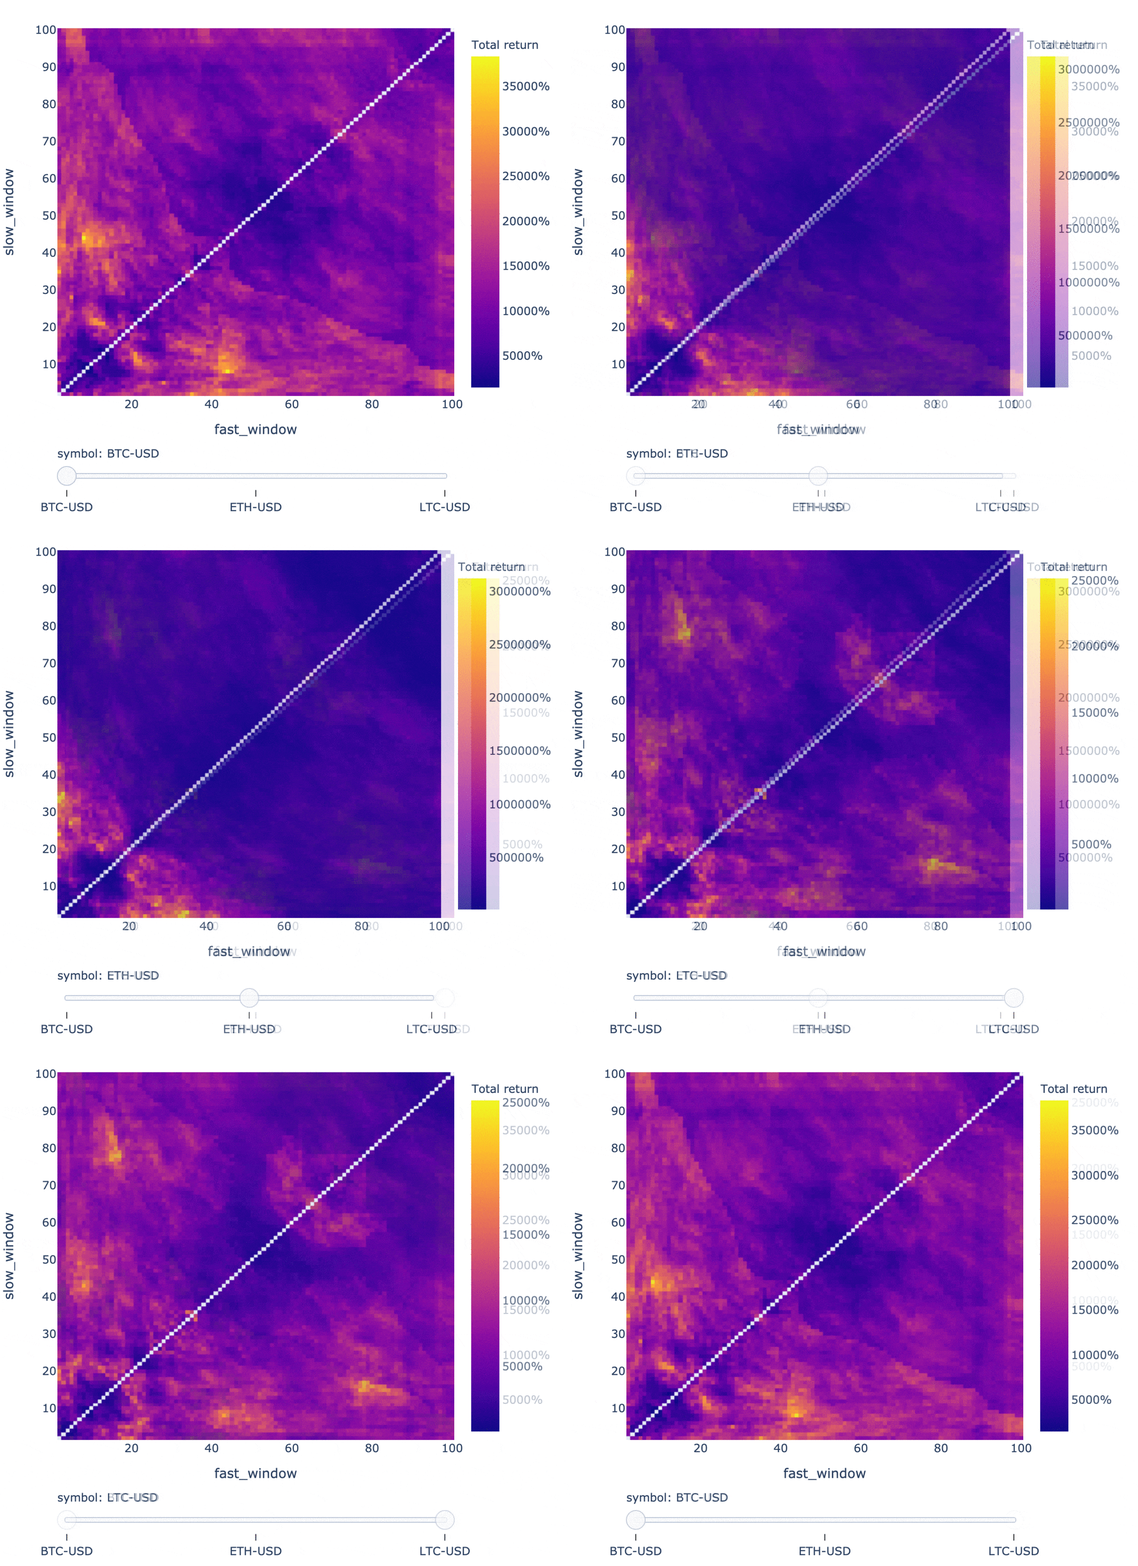
symbols = ["BTC-USD", "ETH-USD", "XRP-USD"]
data = vbt.YFData.download(symbols, missing_index="drop")
price = data.get("Close")

windows = np.arange(2, 101)
fast_ma, slow_ma = vbt.MA.run_combs(price, window=windows, r=2, short_names=["fast", "slow"])
entries = fast_ma.ma_crossed_above(slow_ma)
exits = fast_ma.ma_crossed_below(slow_ma)

pf = vbt.Portfolio.from_signals(price, entries, exits, size=np.inf, fees=0.001, freq="1D")

fig = pf.total_return().vbt.heatmap(
    x_level="fast_window", y_level="slow_window", slider_level="symbol", symmetric=True,
    trace_kwargs=dict(colorbar=dict(title="Total return", tickformat="%")))
fig.show()
Inspect any strategy configuration
print(pf[(10, 20, "ETH-USD")].stats())
Start                          2017-11-09 00:00:00+00:00
End                            2026-01-03 00:00:00+00:00
Period                                2978 days 00:00:00
Start Value                                        100.0
End Value                                    1604.093789
Total Return [%]                             1504.093789
Benchmark Return [%]                          866.094127
Max Gross Exposure [%]                             100.0
Total Fees Paid                               204.226289
Max Drawdown [%]                               70.734951
Max Drawdown Duration                 1095 days 00:00:00
Total Trades                                          81
Total Closed Trades                                   80
Total Open Trades                                      1
Open Trade PnL                                -14.232533
Win Rate [%]                                       41.25
Best Trade [%]                                120.511071
Worst Trade [%]                               -27.772271
Avg Winning Trade [%]                          27.265519
Avg Losing Trade [%]                           -9.022864
Avg Winning Trade Duration    32 days 20:21:49.090909091
Avg Losing Trade Duration      8 days 16:51:03.829787234
Profit Factor                                   1.275515
Expectancy                                     18.979079
Sharpe Ratio                                    0.861945
Calmar Ratio                                    0.572758
Omega Ratio                                      1.20277
Sortino Ratio                                   1.301377
Name: (10, 20, ETH-USD), dtype: object
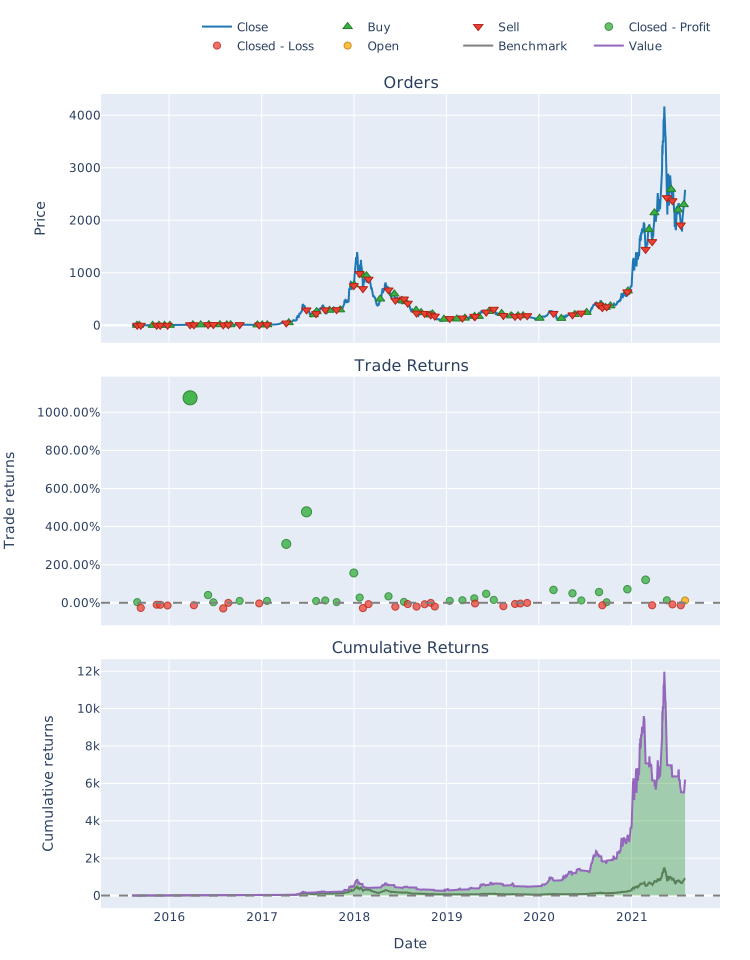
Plot any strategy configuration
pf[(10, 20, "ETH-USD")].plot().show()
Animate Bollinger Bands across multiple symbols
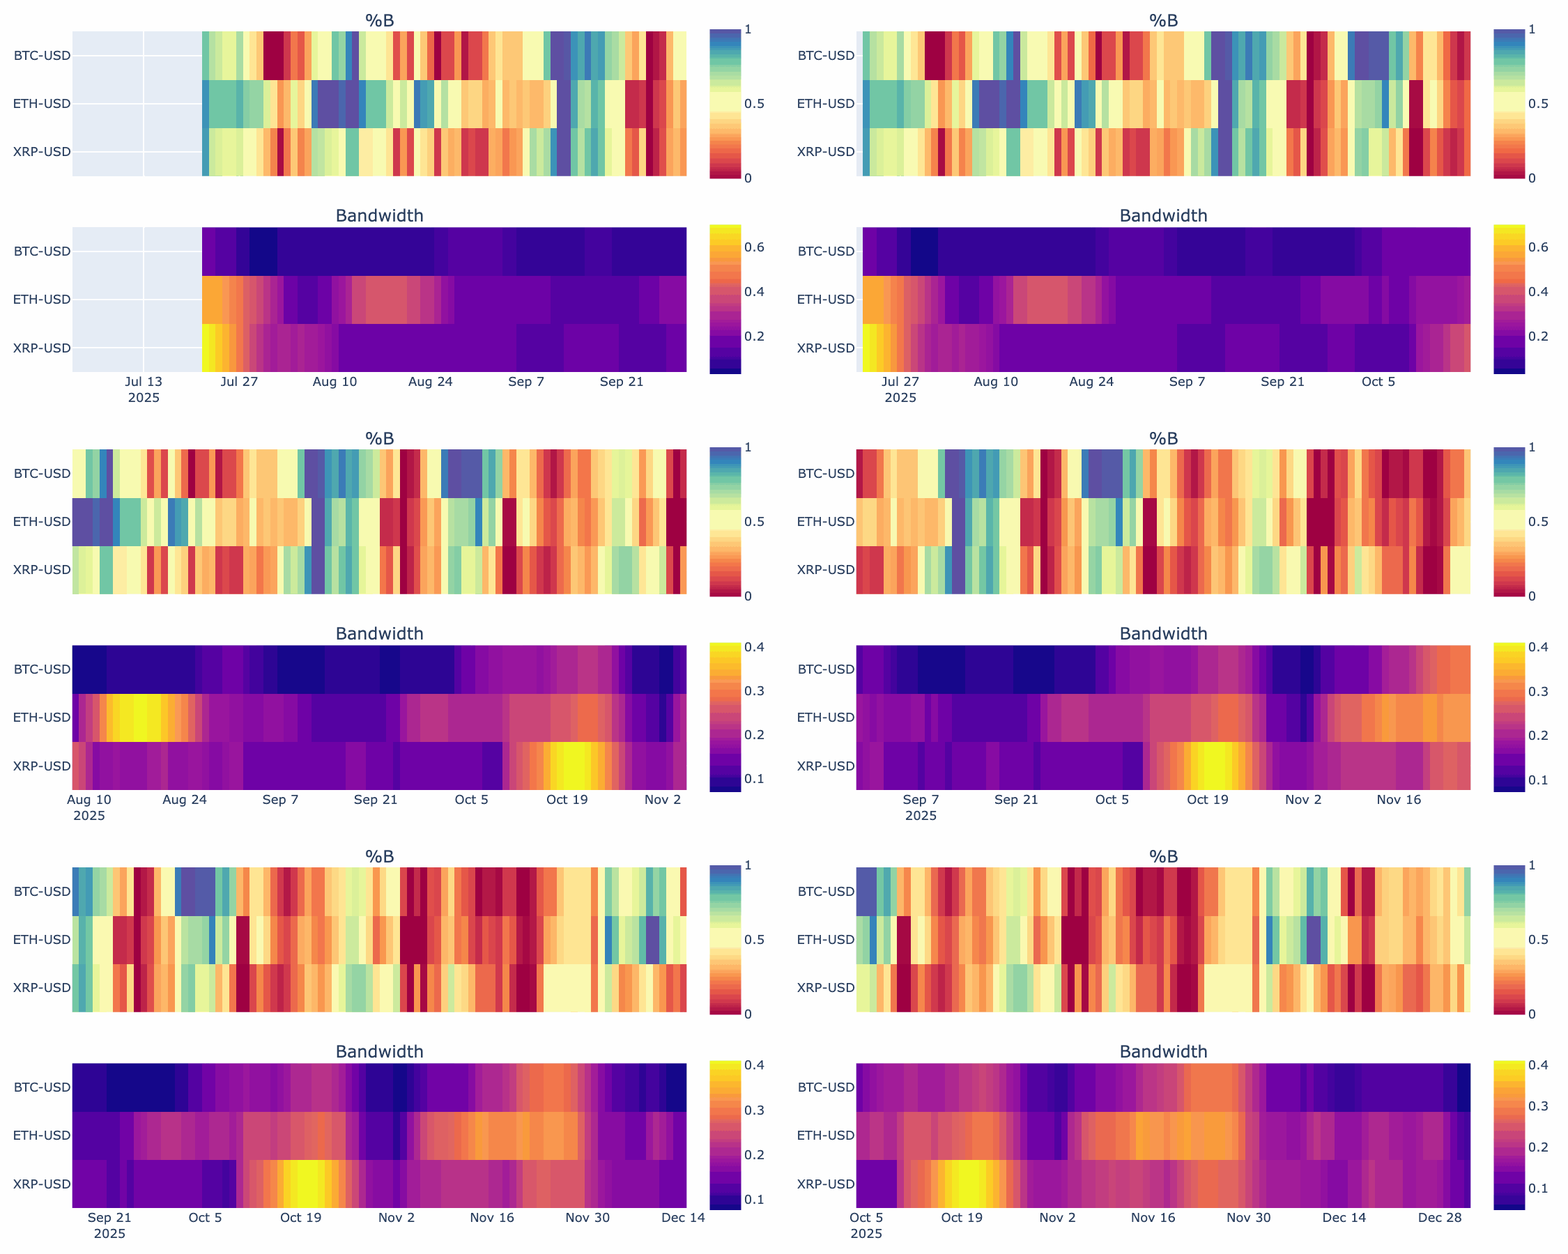
VectorBT goes beyond backtesting, with tools for financial data analysis and visualization:
symbols = ["BTC-USD", "ETH-USD", "XRP-USD"]
data = vbt.YFData.download(symbols, period="6mo", missing_index="drop")
price = data.get("Close")
bbands = vbt.BBANDS.run(price)

def plot(index, bbands):
    bbands = bbands.loc[index]
    fig = vbt.make_subplots(
        rows=2, cols=1, shared_xaxes=True, vertical_spacing=0.15,
        subplot_titles=("%B", "Bandwidth"))
    fig.update_layout(showlegend=False, width=750, height=400)
    bbands.percent_b.vbt.ts_heatmap(
        trace_kwargs=dict(zmin=0, zmid=0.5, zmax=1, colorscale="Spectral", colorbar=dict(
            y=(fig.layout.yaxis.domain[0] + fig.layout.yaxis.domain[1]) / 2, len=0.5
        )), add_trace_kwargs=dict(row=1, col=1), fig=fig)
    bbands.bandwidth.vbt.ts_heatmap(
        trace_kwargs=dict(colorbar=dict(
            y=(fig.layout.yaxis2.domain[0] + fig.layout.yaxis2.domain[1]) / 2, len=0.5
        )), add_trace_kwargs=dict(row=2, col=1), fig=fig)
    return fig

vbt.save_animation("bbands.gif", bbands.wrapper.index, plot, bbands, delta=90, step=3, fps=3)
100%|██████████| 31/31 [00:21<00:00, 1.21it/s]
Visit the website for more examples, documentation, and guides.
Example apps
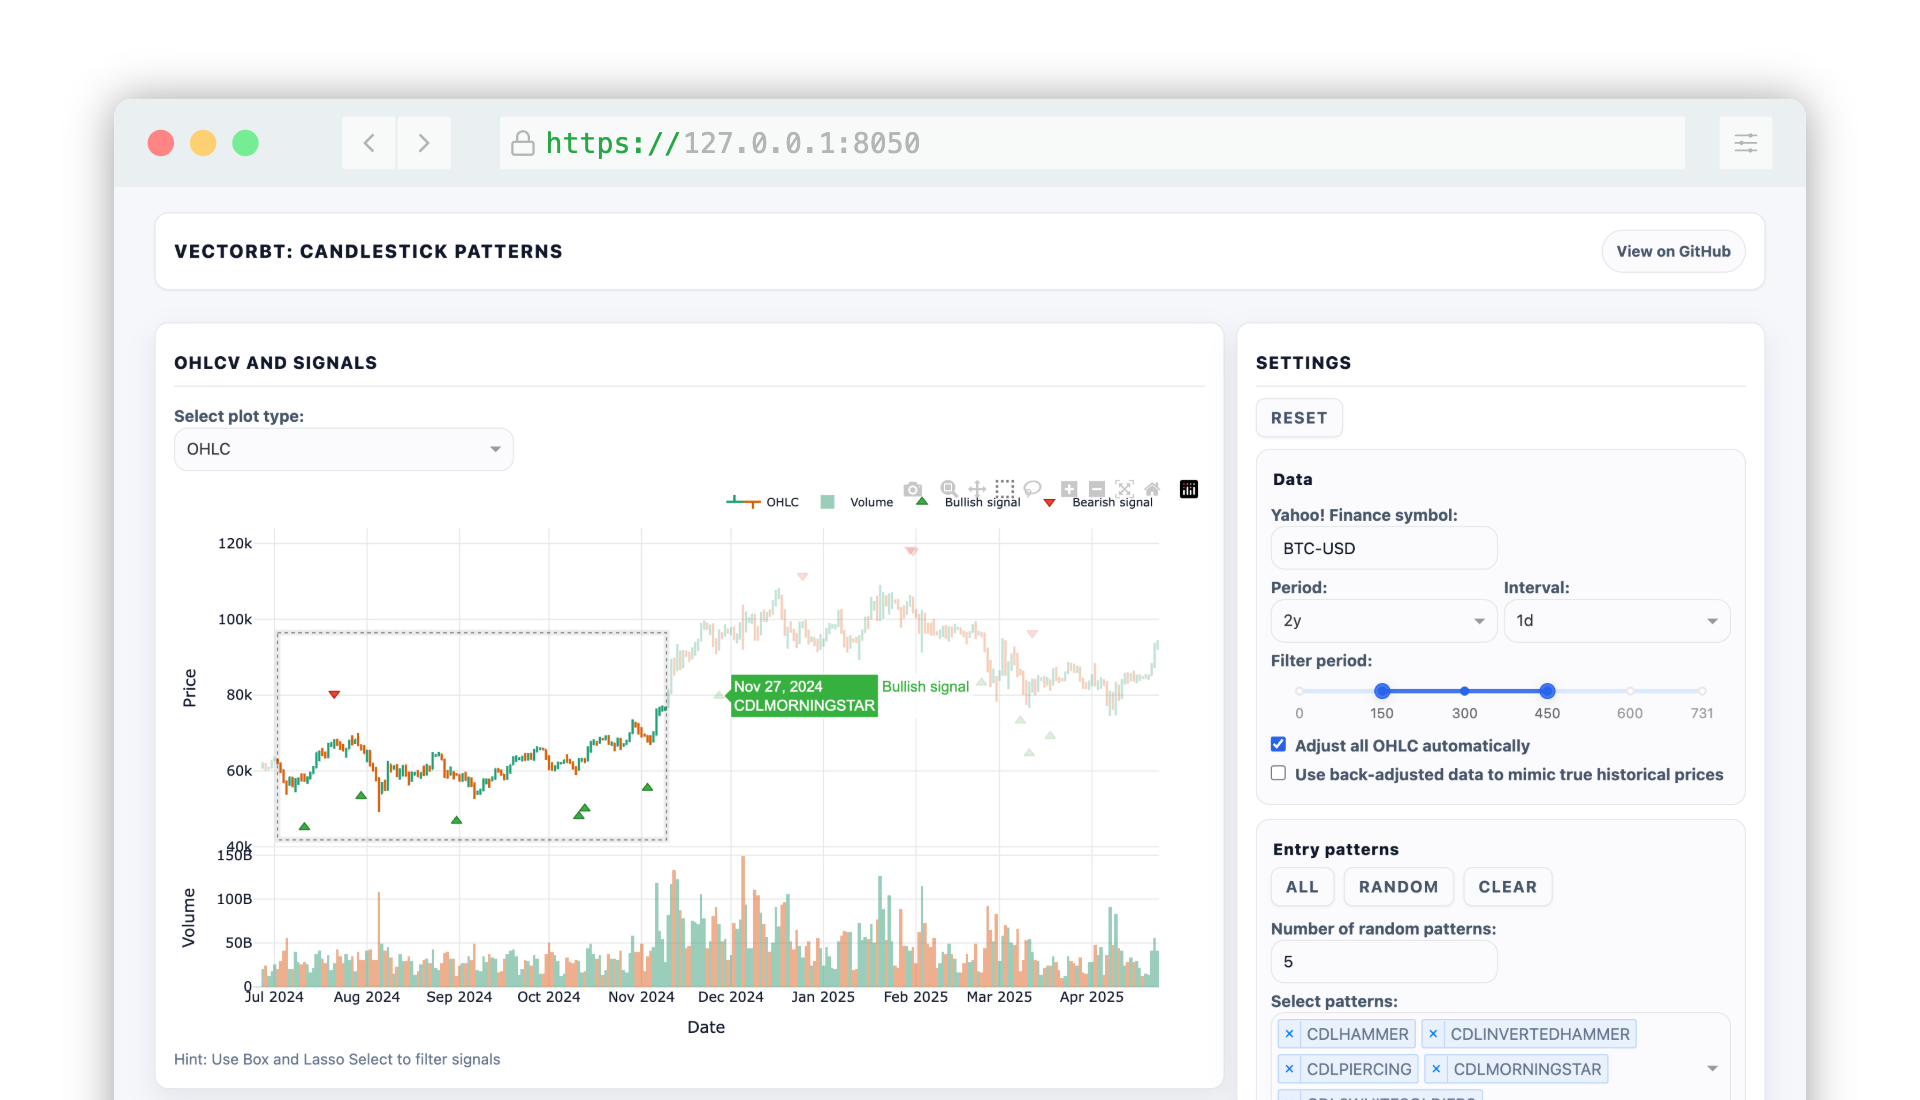
Candlestick Patterns
Explore candlestick patterns interactively and backtest their signals with VectorBT.
Links
License
This work is fair-code distributed under the Apache 2.0 with Commons Clause license.
The source code is publicly available, and everyone (individuals and organizations) may use it for free. However, you may not sell products or services that are primarily this software.
If you have questions or want to request a license exception, please contact the author.
Installing optional dependencies may be subject to a more restrictive license.
Star history
Disclaimer
This software is for educational purposes only. Do not risk money you cannot afford to lose.
Use the software at your own risk. The authors and affiliates assume no responsibility for your trading results.