Visualize, query, and stream to train on multimodal robotics data.
cargo add rerun





The data layer for physical AI
Log, query, visualize, and stream to training on shared columnar storage built for multimodal data.
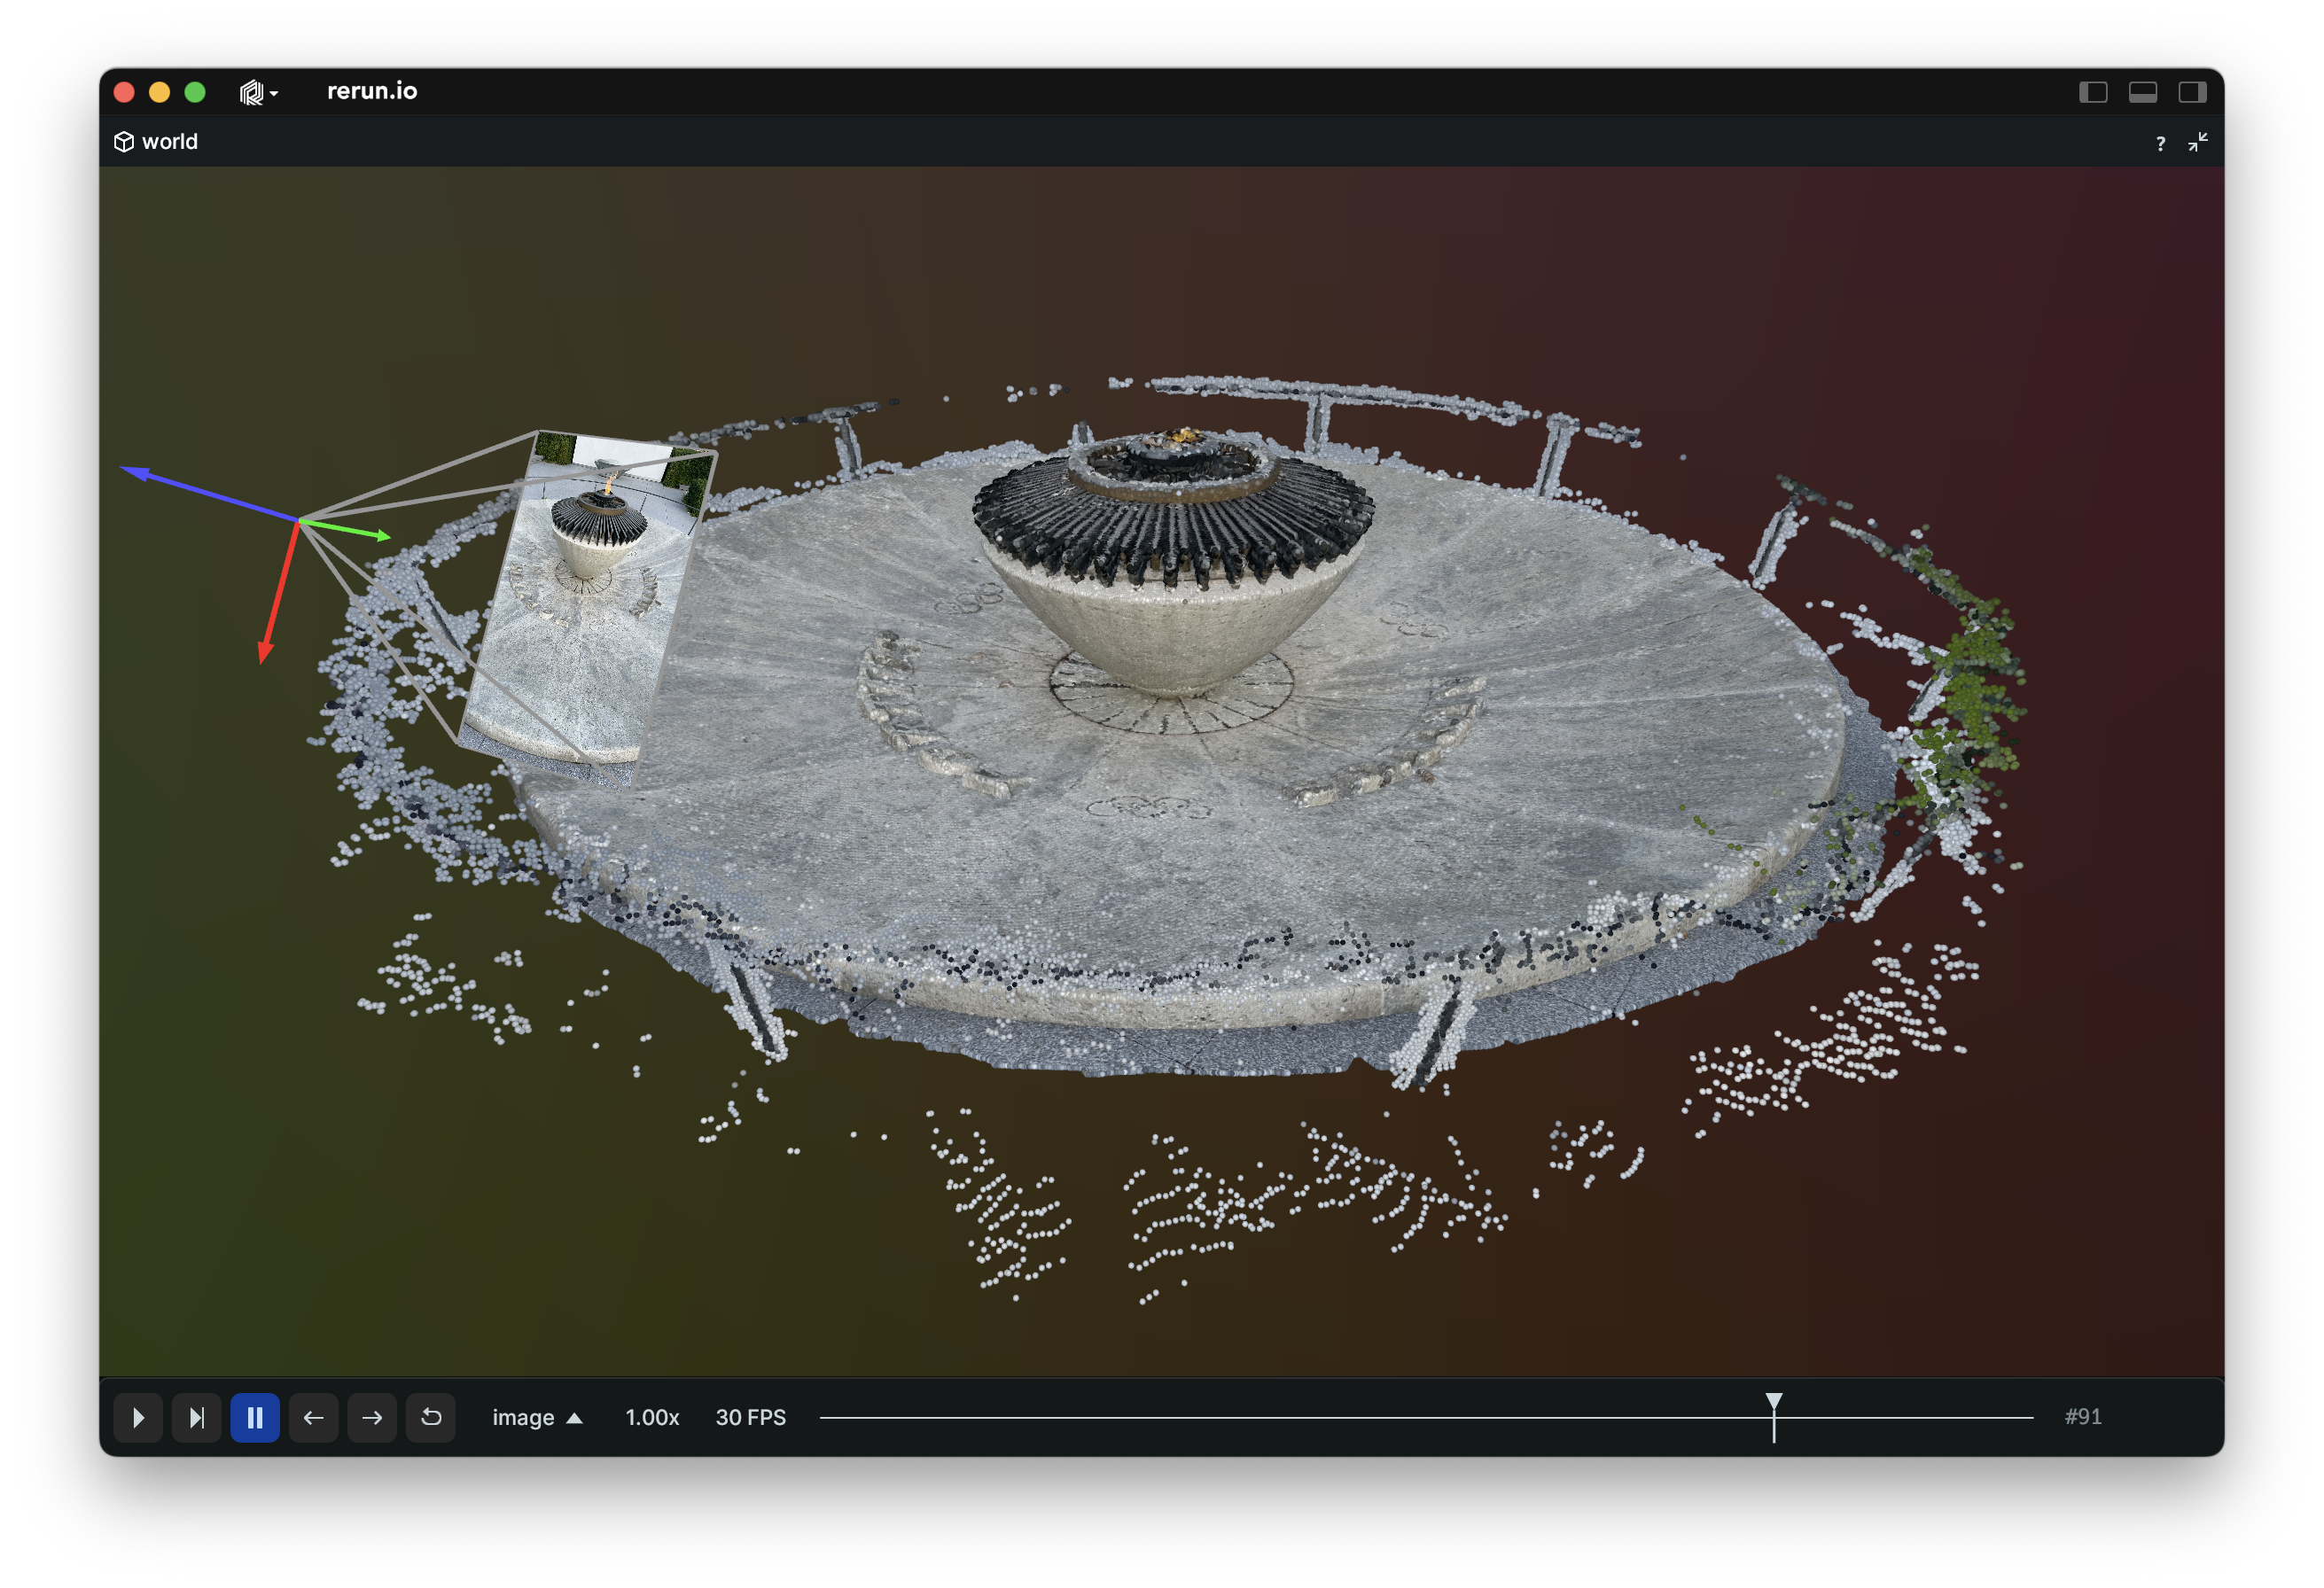
What it does: Rerun ingests multi-rate, multimodal data (images, point clouds, transforms, time series, joint states, video) from many sources and formats (robot logs, human-data rigs, sim, web video; MCAP, rrd, LeRobot). The built-in viewer renders everything in sync, in realtime: scrub episodes, compare sensors side-by-side, watch CV pipelines run live. The same data is queryable with dataframes or SQL, and streams directly into training. Built in Rust on column-chunk storage purpose-built for multi-rate physical data. SDKs in Python, Rust, and C++.
Quickstart: pip install rerun-sdk — log your first multimodal data and see it in the viewer in under 2 minutes.
Use cases
- Ingest robot logs, egocentric/UMI rigs, sim, and web video into one substrate
- Run CV pipelines (SLAM, hand tracking, motion retargeting) as table edits
- Query raw, intermediate, and derived data with dataframes or SQL
- Visualize multi-rate, multimodal sequences across the pipeline
- Stream dataset mixes directly to training — no export jobs, no stale copies
Data types
Multi-rate, multimodal, spatial: images, point clouds, time series, tensors, transforms, joint states, video. Preserved end-to-end.
A short taste
import rerun as rr  # pip install rerun-sdk

rr.init("rerun_example_app")

rr.spawn()  # Spawn a child process with a viewer and connect
# rr.save("recording.rrd")  # Stream all logs to disk
# rr.connect_grpc()  # Connect to a remote viewer

# Associate subsequent data with 42 on the “frame” timeline
rr.set_time("frame", sequence=42)

# Log colored 3D points to the entity at `path/to/points`
rr.log("path/to/points", rr.Points3D(positions, colors=colors))
…
Getting started
Installing the Rerun Viewer binary
To stream log data over the network or load our .rrd data files you also need the rerun binary.
It can be installed with pip install rerun-sdk or with cargo install rerun-cli --locked --features nasm (see note below).
Note that only the Python SDK comes bundled with the Viewer whereas C++ & Rust always rely on a separate install.
Note: the nasm Cargo feature requires the nasm CLI to be installed and available in your path.
Alternatively, you may skip enabling this feature, but this may result in inferior video decoding performance.
You should now be able to run rerun --help in any terminal.
Documentation
- 📚 High-level docs
- ⏃ Loggable Types
- ⚙️ Examples
- 📖 Code snippets
- 🌊 C++ API docs
- 🐍 Python API docs
- 🦀 Rust API docs
- ⁉️ Troubleshooting
Agent skills
This repo ships a set of agent skills that help coding agents write Rerun code.
Install them into your agent with the skills CLI:
npx skills add rerun-io/rerun
The skills themselves live in skills/ if you want to read them directly.
Status
We are in active development. There are many features we want to add, and the API is still evolving. Expect breaking changes!
Some shortcomings:
What is Rerun for?
Rerun is built to help you understand and improve complex processes that include rich multimodal data, like 2D, 3D, text, time series, tensors, etc. It is used in many industries, including robotics, simulation, computer vision, or anything that involves a lot of sensors or other signals that evolve over time.
Example use case
Say you're building a vacuum cleaning robot and it keeps running into walls. Why is it doing that? You need some tool to debug it, but a normal debugger isn't gonna be helpful. Similarly, just logging text won't be very helpful either. The robot may log "Going through doorway" but that won't explain why it thinks the wall is a door.
What you need is a visual and temporal debugger, that can log all the different representations of the world the robots holds in its little head, such as:
- RGB camera feed
- depth images
- lidar scan
- segmentation image (how the robot interprets what it sees)
- its 3D map of the apartment
- all the objects the robot has detected (or thinks it has detected), as 3D shapes in the 3D map
- its confidence in its prediction
- etc
You also want to see how all these streams of data evolve over time so you can go back and pinpoint exactly what went wrong, when and why.
Maybe it turns out that a glare from the sun hit one of the sensors in the wrong way, confusing the segmentation network leading to bad object detection. Or maybe it was a bug in the lidar scanning code. Or maybe the robot thought it was somewhere else in the apartment, because its odometry was broken. Or it could be one of a thousand other things. Rerun will help you find out!
But seeing the world from the point of the view of the robot is not just for debugging - it will also give you ideas on how to improve the algorithms, new test cases to set up, or datasets to collect. It will also let you explain the brains of the robot to your colleagues, boss, and customers. And so on. Seeing is believing, and an image is worth a thousand words, and multimodal temporal logging is worth a thousand images :)
While seeing and understanding your data is core to making progress in robotics, there is one more thing: You can also use the data you collected for visualization to create new datasets for training and evaluating the models and algorithms that run on your robot. Rerun provides query APIs to make it easy to extract clean datasets from your recording for exactly that purpose.
Of course, Rerun is useful for much more than just robots. Any time you have any form of sensors, or 2D or 3D state evolving over time, Rerun is a great tool.
Rerun vs. Rviz
When coming from pure visualization tools like RViz, you might be used to seeing the latest data only. Rerun is more than a pure visualization solution, it provides a platform for multimodal data with a powerful visualizer, storage model and query engine (see also: "What is Rerun?"). In robotics, you can use Rerun e.g. to record test runs, manage and query training data, visually debug live streams or recordings (also from third-party formats like MCAP) and much more.
So while Rerun makes your data streams visualizable in the viewer, integrating Rerun logging into your robotics applications also opens up the door for leveraging Rerun's broader capabilities.
If you are only interested in visualization, the Rerun viewer has powerful features like the ability to go back in time thanks to its time-aware in-memory database. You can adjust the size of this buffer to your needs (see here), e.g. to a smaller size if you want to use Rerun as an RViz replacement in long-running or memory-constrained applications.
Business model
Rerun uses an open-core model. Everything in this repository will stay open source and free (both as in beer and as in freedom).
We are also building Rerun Hub, a scalable catalog for robotic data. Right now that is only available for a few select design partners. Click here if you're interested.
The Rerun open source project targets the needs of individual developers. The commercial product targets the needs specific to teams that build and run computer vision and robotics products.
How to cite Rerun
When using Rerun in your research, please cite it to acknowledge its contribution to your work. This can be done by including a reference to Rerun in the software or methods section of your paper.
Suggested citation format:
@software{RerunSDK,
  title = {Rerun: A Visualization SDK for Multimodal Data},
  author = {{Rerun Development Team}},
  url = {https://www.rerun.io},
  version = {insert version number},
  date = {insert date of usage},
  year = {2024},
  publisher = {{Rerun Technologies AB}},
  address = {Online},
  note = {Available from https://www.rerun.io/ and https://github.com/rerun-io/rerun}
}
Please replace "insert version number" with the version of Rerun you used and "insert date of usage" with the date(s) you used the tool in your research. This citation format helps ensure that Rerun's development team receives appropriate credit for their work and facilitates the tool's discovery by other researchers.
Development
ARCHITECTURE.mdCODE_OF_CONDUCT.mdCODE_STYLE.mdCONTRIBUTING.mdBUILD.mdrerun_py/README.md- instructions for Python SDKrerun_cpp/README.md- instructions for C++ SDK
Installing a pre-release Python SDK
- Download the correct
.whlfrom GitHub Releases - Run
pip install rerun_sdk<…>.whl(replace<…>with the actual filename) - Test it:
rerun --version