utkuozdemir/nvidia_gpu_exporter
GoNvidia GPU exporter for prometheus using nvidia-smi binary
go get github.com/utkuozdemir/nvidia_gpu_exporternvidia_gpu_exporter





Nvidia GPU exporter for prometheus, using nvidia-smi binary to gather metrics.
[!WARNING] Heads up: this is a side project I maintain in my spare time. I might take a long time to look at issues or PRs, or not get to them at all. Sorry in advance, and thanks for understanding.
Introduction
This is a simple exporter that uses the nvidia-smi(.exe) binary to collect,
parse and export metrics. Since it only needs nvidia-smi, it also works on
Windows - no Docker or Linux required.
It can also skip nvidia-smi and read the metrics straight from the NVIDIA
Management Library (NVML). This mode is experimental and exposes some things
nvidia-smi cannot provide, like per-MIG-instance metrics and XID error
counters; see CONFIGURE.md.
This project is based on a0s/nvidia-smi-exporter. However, this one is written in Go to produce a single, static binary.
Use cases
- Consumer and prosumer GPUs (GeForce/RTX), where the datacenter tooling
exposes little and
nvidia-smiis often the only uniform source of utilization, memory, power and temperature - Small Kubernetes clusters, edge boxes and homelabs that want GPU metrics without installing the NVIDIA GPU Operator stack
- Virtualized or restricted setups (vGPU guests, MIG slices, locked-down containers)
where the deeper GPU counters are not exposed but
nvidia-smistill answers - Mixed fleets of old and new cards that need one exporter that behaves the same everywhere
- Gaming rigs, for watching your GPU stats on a dashboard while you play
If you run datacenter cards on Kubernetes with the GPU Operator already installed, DCGM-exporter is probably the better fit; this exporter aims at the cases above.
Highlights
- Will work on any system that has
nvidia-smi(.exe)?binary - Windows, Linux, MacOS... No C bindings required - Doesn't even need to run the monitored machine: can be configured to execute
nvidia-smicommand remotely - Auto-discovery of the metric fields
nvidia-smican expose (future-compatible) - Optional per-process GPU metrics: see which process uses how much GPU memory
- Optional background collection: run
nvidia-smion a timer instead of on every scrape - Comes with its own Grafana dashboard
Try it without a GPU
Demo mode serves realistic synthetic metrics, including the NVML-only families, with no GPU, driver or even Linux required:
nvidia_gpu_exporter --collect.backend demo
By default it simulates two H200 GPUs with fluctuating values, a MIG topology and an XID error history. The simulated setup is configurable; see CONFIGURE.md.
Visualization
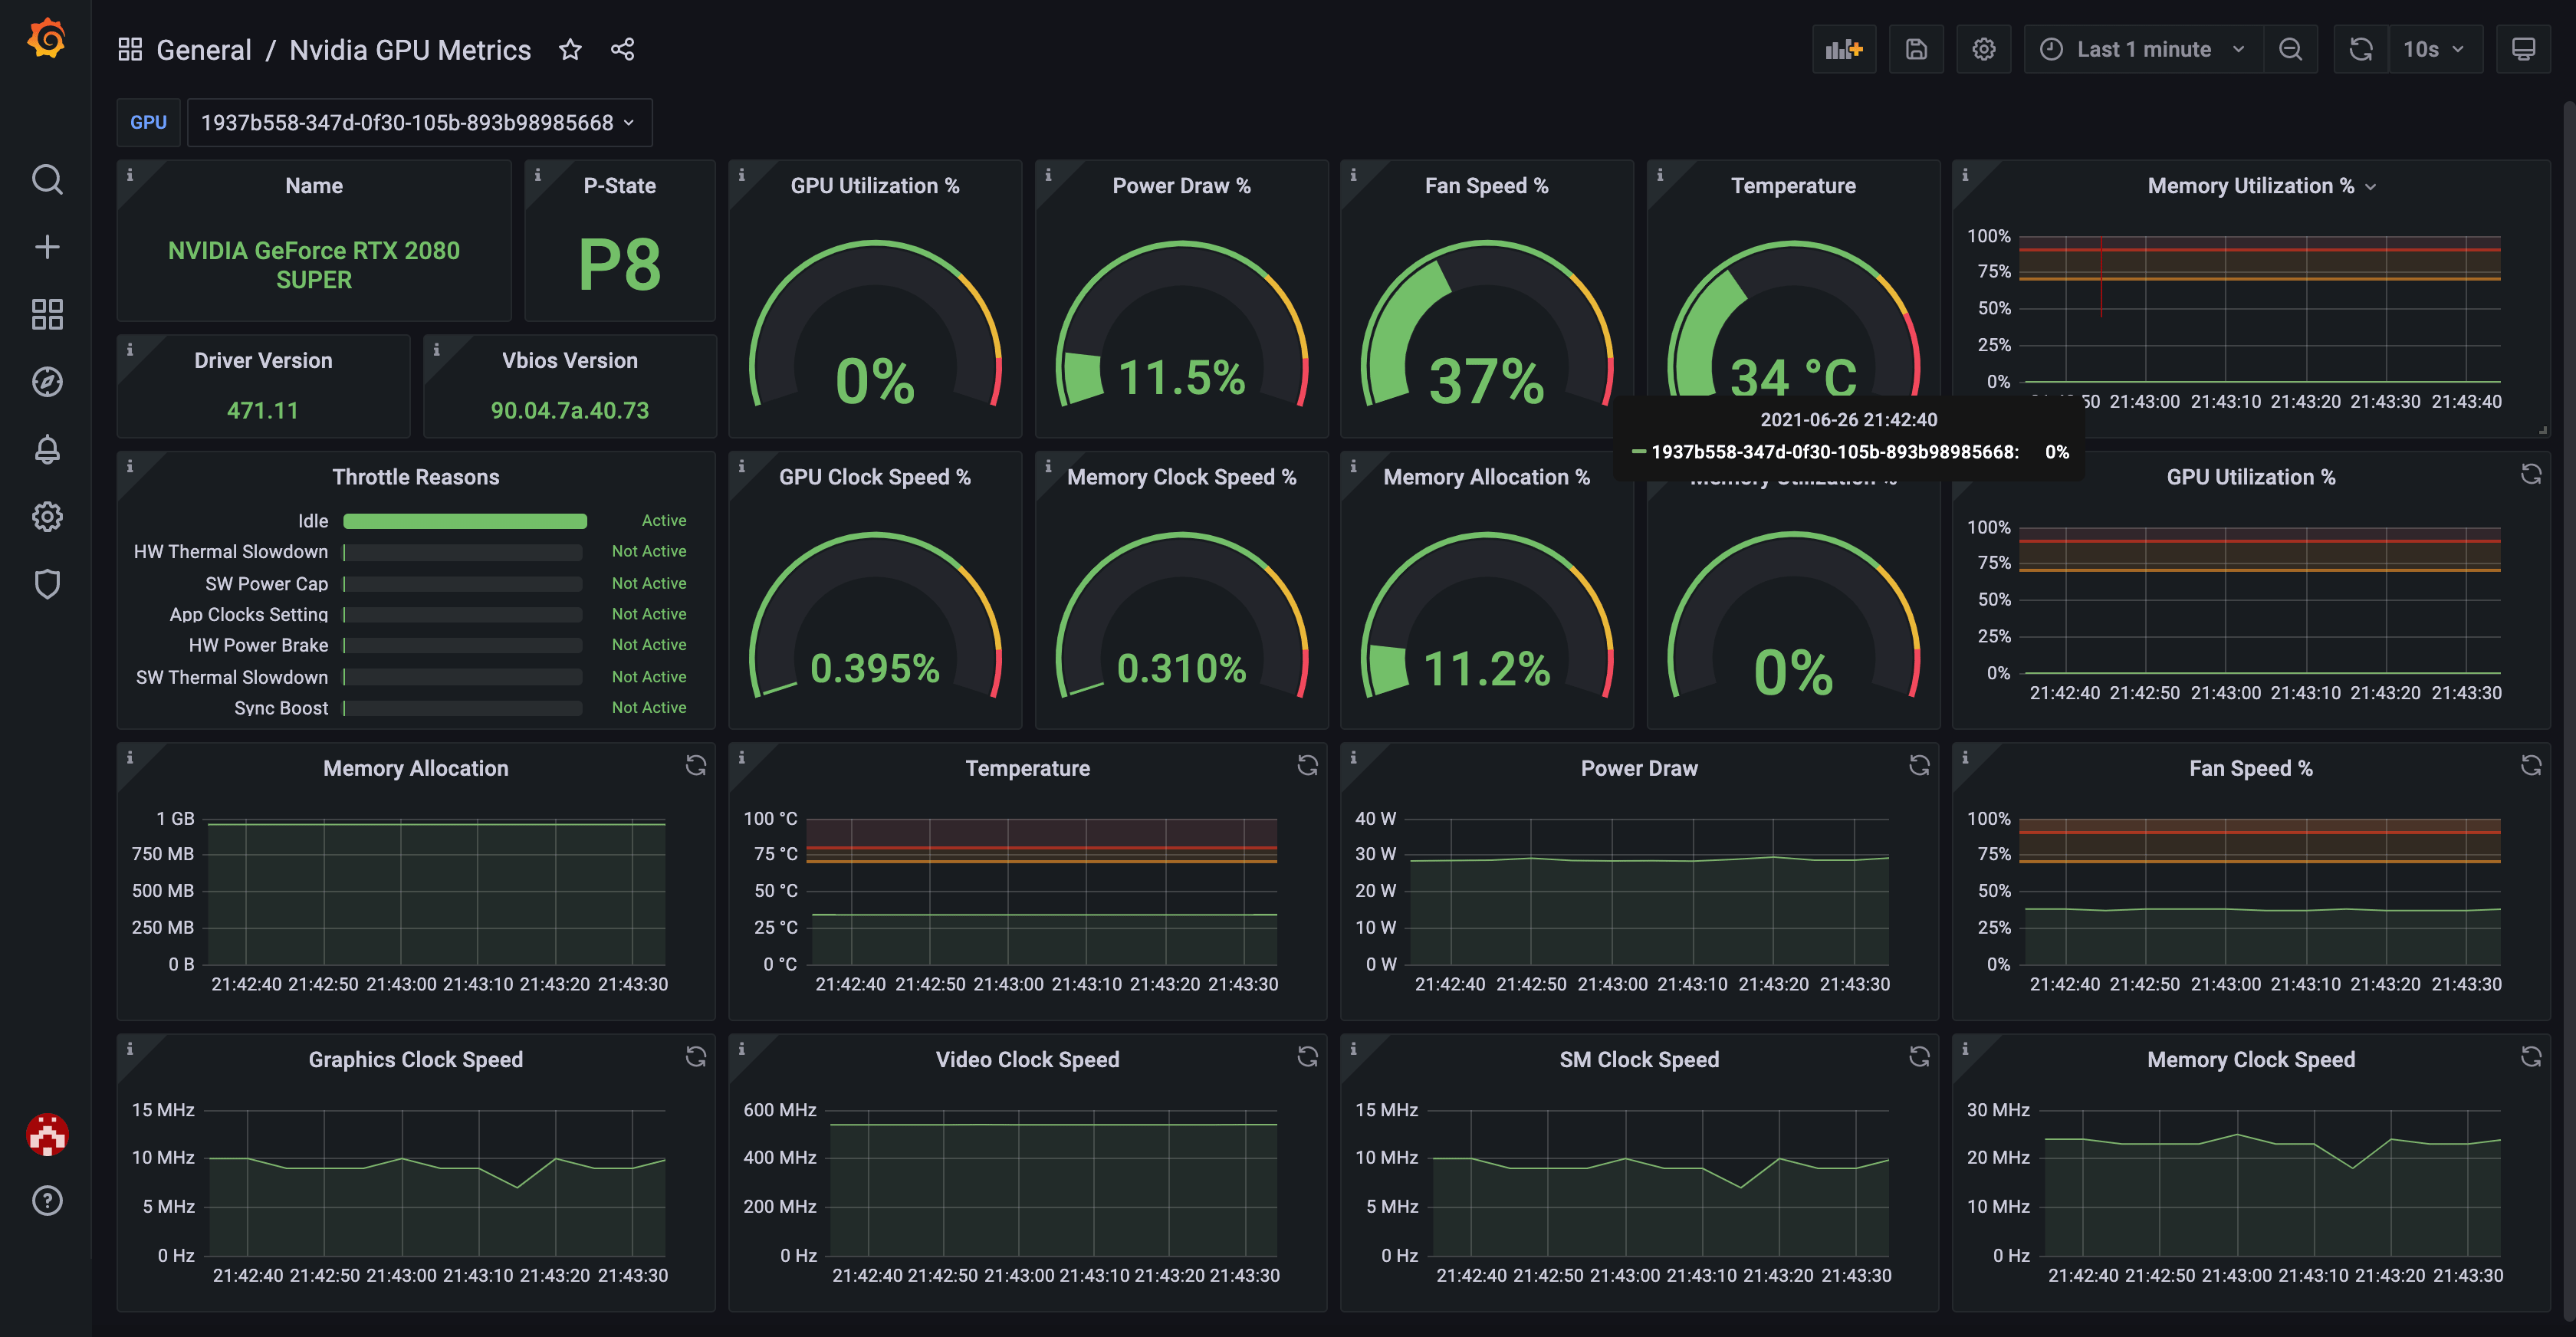
You can use the official Grafana dashboard to see your GPU metrics in a nicely visualized way.
Here's how it looks:
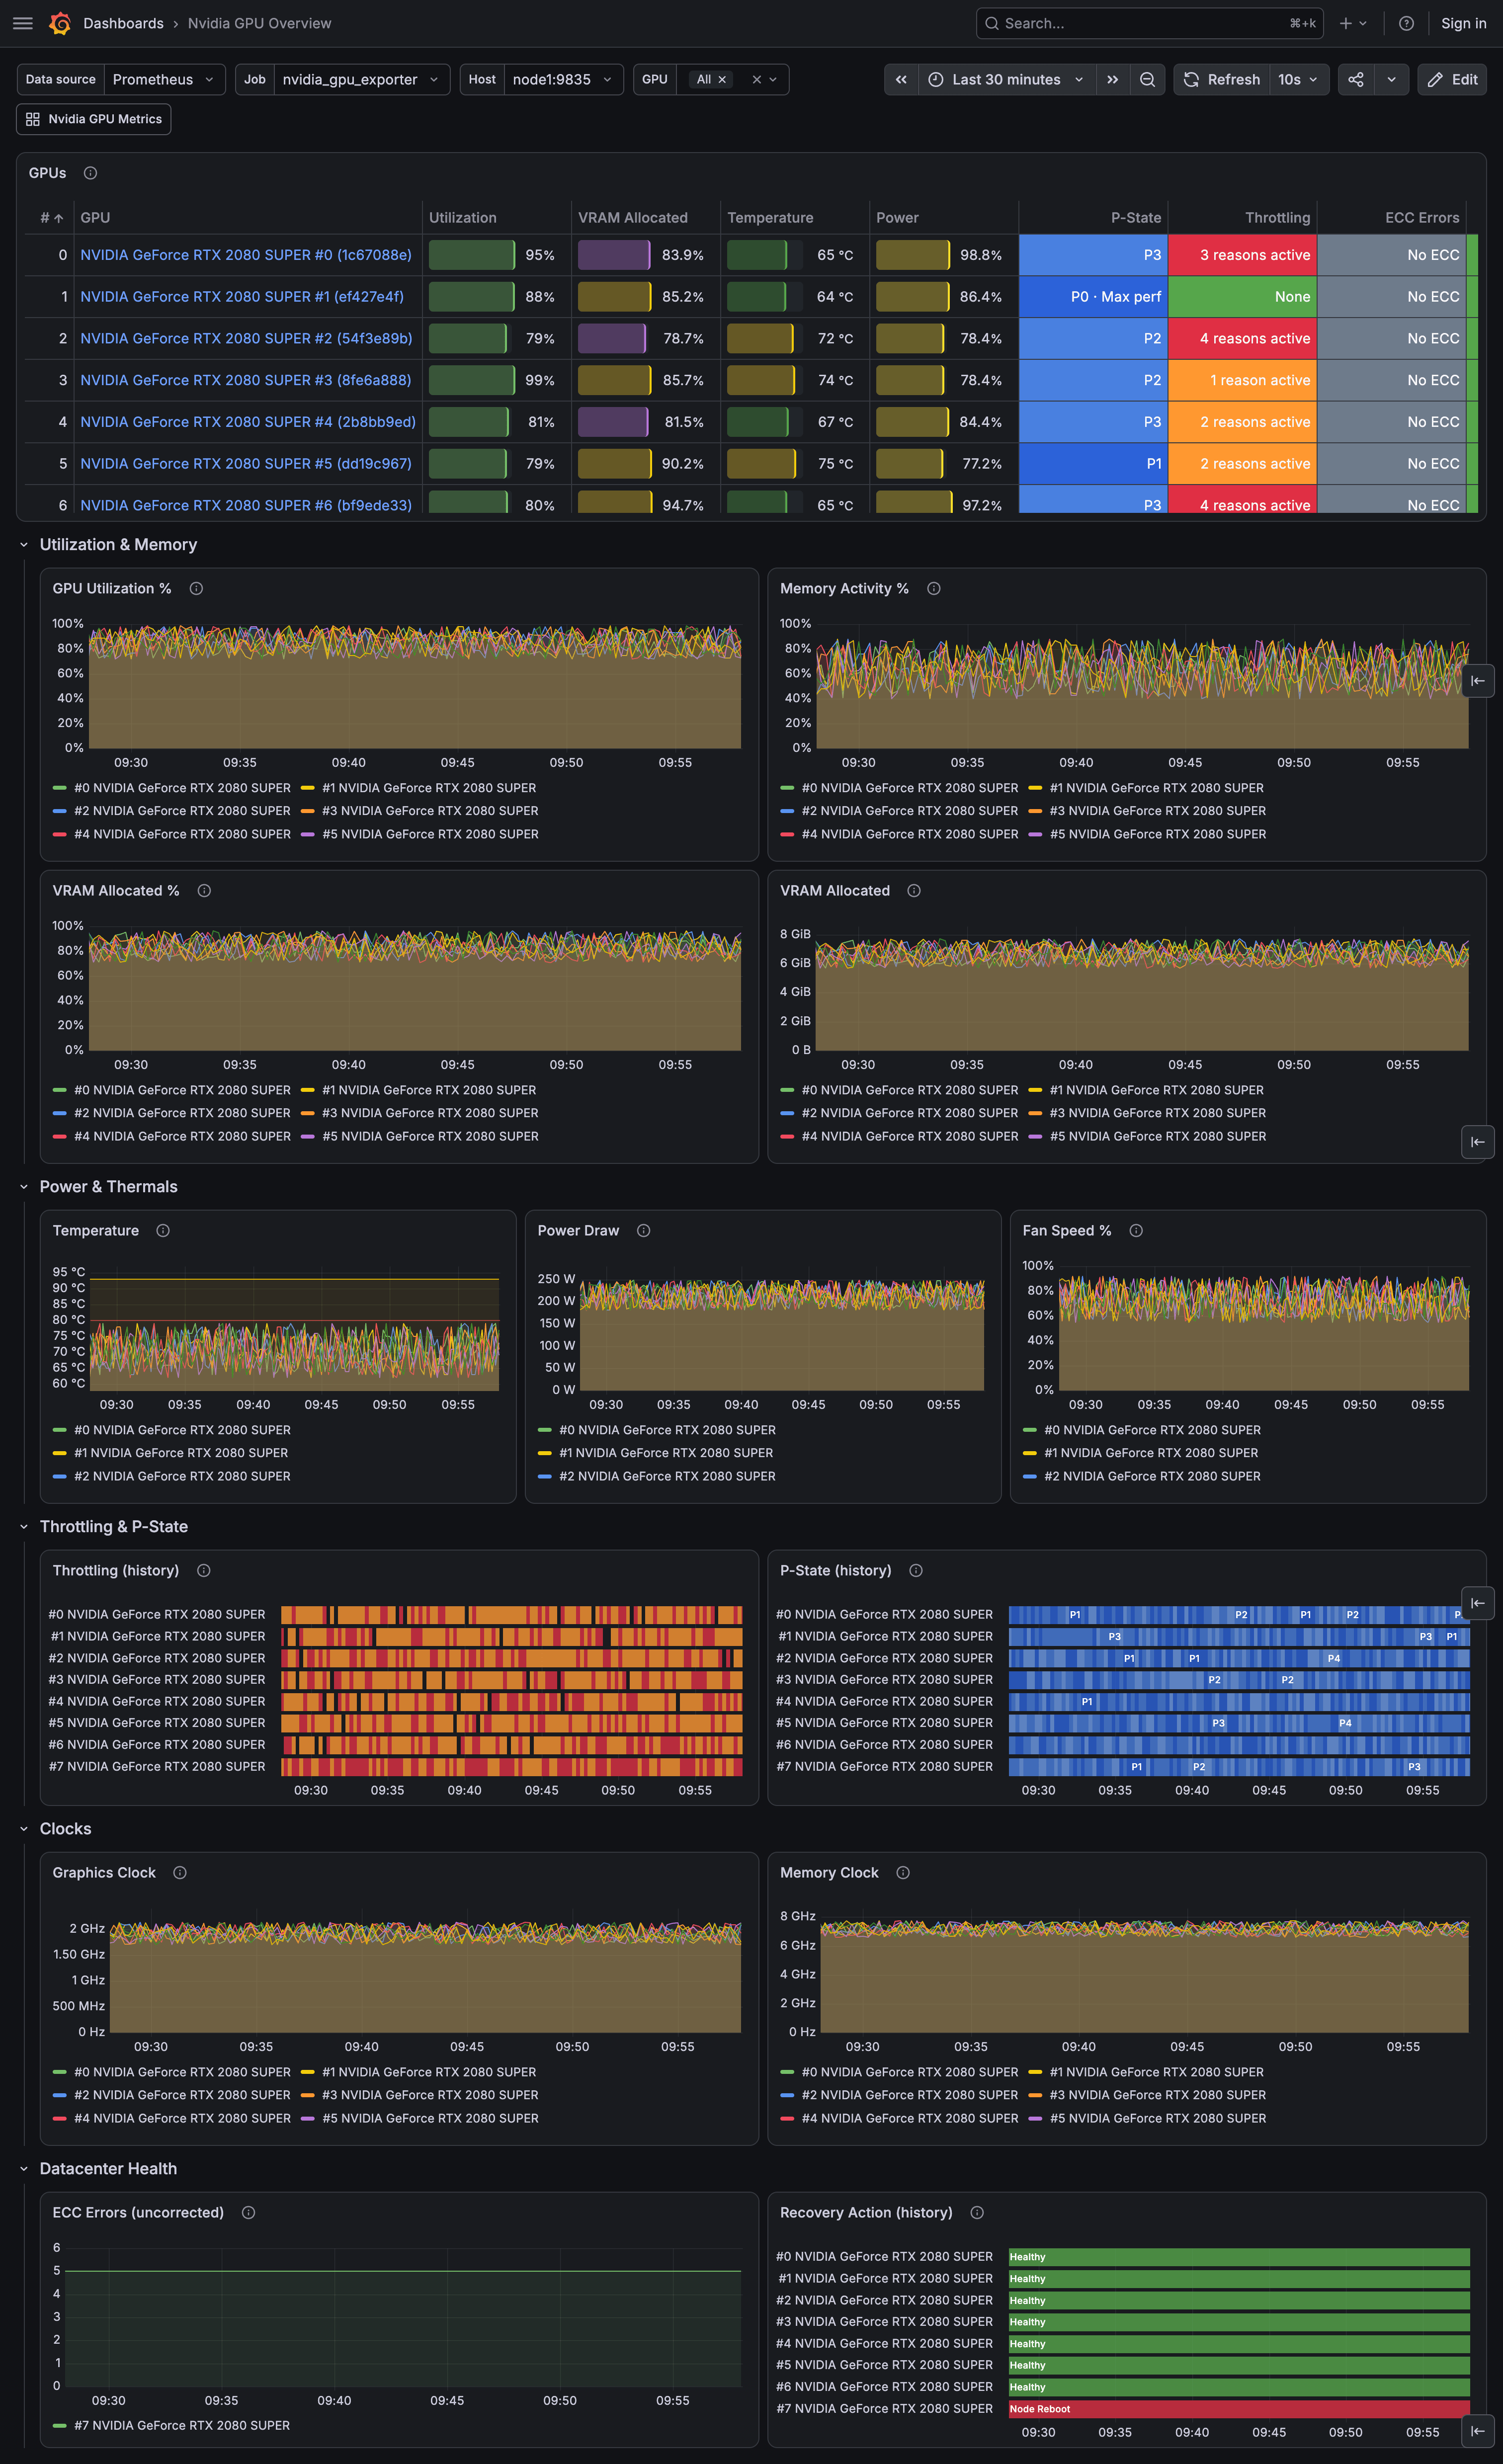
For machines with more than one GPU there is a companion
overview dashboard
that compares all GPUs of a node side by side and drills down into the
single-GPU dashboard above. Import it from the JSON file, or enable
grafanaDashboard in the Helm chart to get both dashboards provisioned.
Installation
You can install it from plain binaries, deb/rpm packages, winget, Docker images or the Helm chart. See INSTALL.md for details.
Verifying releases
Release artifacts are signed so you can check they came from this project's release pipeline:
- The
checksums.txtfile attached to each release is signed with GPG (checksums.txt.asc), which covers every binary, archive and package. - The container images and the Helm chart are signed keyless with cosign, tied to the release workflow's identity.
See INSTALL.md for the exact verification commands, and the chart README for the chart.
Configuration
See CONFIGURE.md for details.
Metrics
See METRICS.md for details.
Contributing
See CONTRIBUTING.md for details.
Help wanted: contribute a GPU capture
The exporter parses nvidia-smi output, which differs across GPU models, driver
versions and operating systems. If you have hardware that isn't covered yet
(datacenter cards, MIG, multi-GPU, Windows/WSL2, brand-new drivers...), you can
help a lot by capturing your nvidia-smi output with one command:
./internal/captures/collect.sh # add --load for an under-load sample too
It needs only nvidia-smi, bash, and the standard core utilities (awk,
sed, ...), runs read-only, and masks identifiers (GPU UUID, serial, hostname)
by default. It writes one .txt file: commit it and open a PR, or attach it to
an issue. See internal/captures/README.md.