Make Complex Heatmaps
Make Complex Heatmaps 





Complex heatmaps are efficient to visualize associations between different sources of data sets and reveal potential patterns. Here the ComplexHeatmap package provides a highly flexible way to arrange multiple heatmaps and supports various annotation graphics.
The InteractiveComplexHeatmap package can directly export static complex heatmaps into an interactive Shiny app. Have a try!
Citation
Zuguang Gu, et al., Complex heatmaps reveal patterns and correlations in multidimensional genomic data, Bioinformatics, 2016.
Zuguang Gu. Complex Heatmap Visualization, iMeta, 2022.
Install
ComplexHeatmap is available on Bioconductor, you can install it by:
if (!requireNamespace("BiocManager", quietly=TRUE))
    install.packages("BiocManager")
BiocManager::install("ComplexHeatmap")
If you want the latest version, install it directly from GitHub:
library(devtools)
install_github("jokergoo/ComplexHeatmap")
Usage
Make a single heatmap:
Heatmap(mat, ...)
A single Heatmap with column annotations:
ha = HeatmapAnnotation(df = anno1, anno_fun = anno2, ...)
Heatmap(mat, ..., top_annotation = ha)
Make a list of heatmaps:
Heatmap(mat1, ...) + Heatmap(mat2, ...)
Make a list of heatmaps and row annotations:
ha = HeatmapAnnotation(df = anno1, anno_fun = anno2, ..., which = "row")
Heatmap(mat1, ...) + Heatmap(mat2, ...) + ha
Documentation
The full documentations are available at https://jokergoo.github.io/ComplexHeatmap-reference/book/ and the website is at https://jokergoo.github.io/ComplexHeatmap.
Blog posts
There are following blog posts focusing on specific topics:
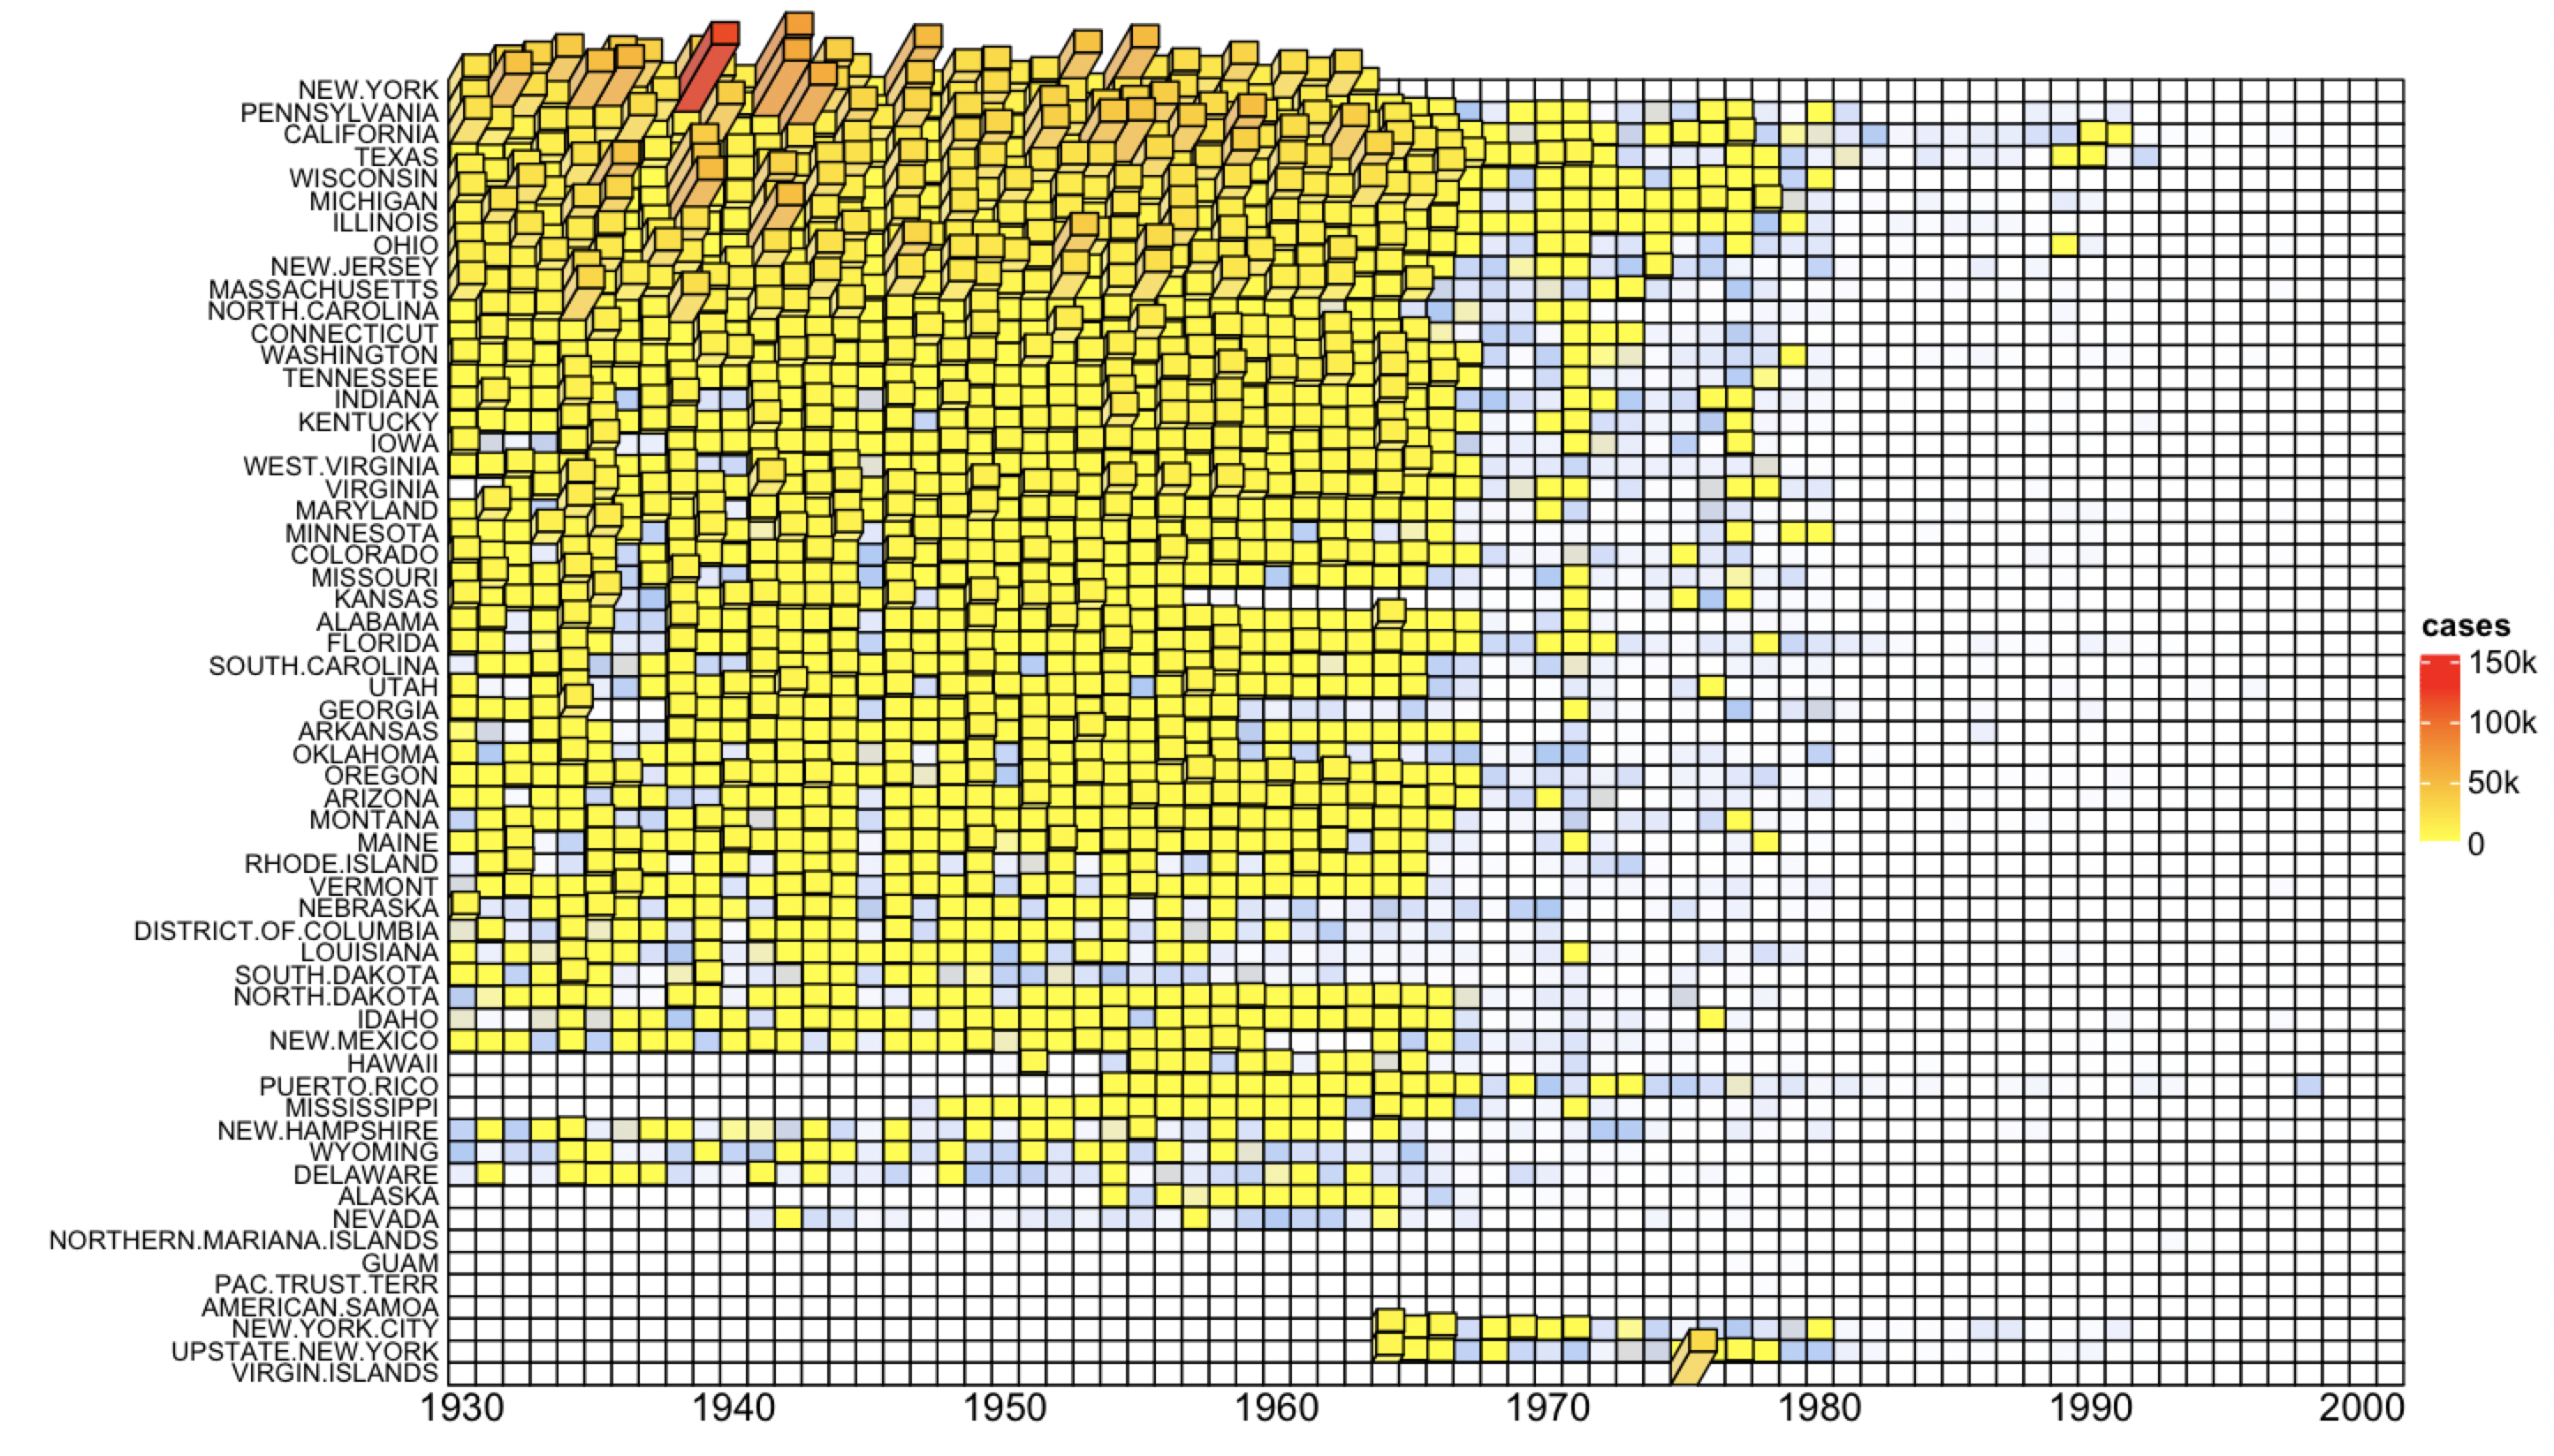
- Make 3D heatmap
- Translate from pheatmap to ComplexHeatmap
- Set cell width/height in the heatmap
- Interactive ComplexHeatmap
- Word cloud as heatmap annotation
- Which heatmap function is faster?
- Rasterization in ComplexHeatmap
- Block annotation over several slices
- Integrate ComplexHeatmap with cowplot package
Examples
Visualize Methylation Profile with Complex Annotations

Correlations between methylation, expression and other genomic features

Visualize Cell Heterogeneity from Single Cell RNASeq

Making Enhanced OncoPrint

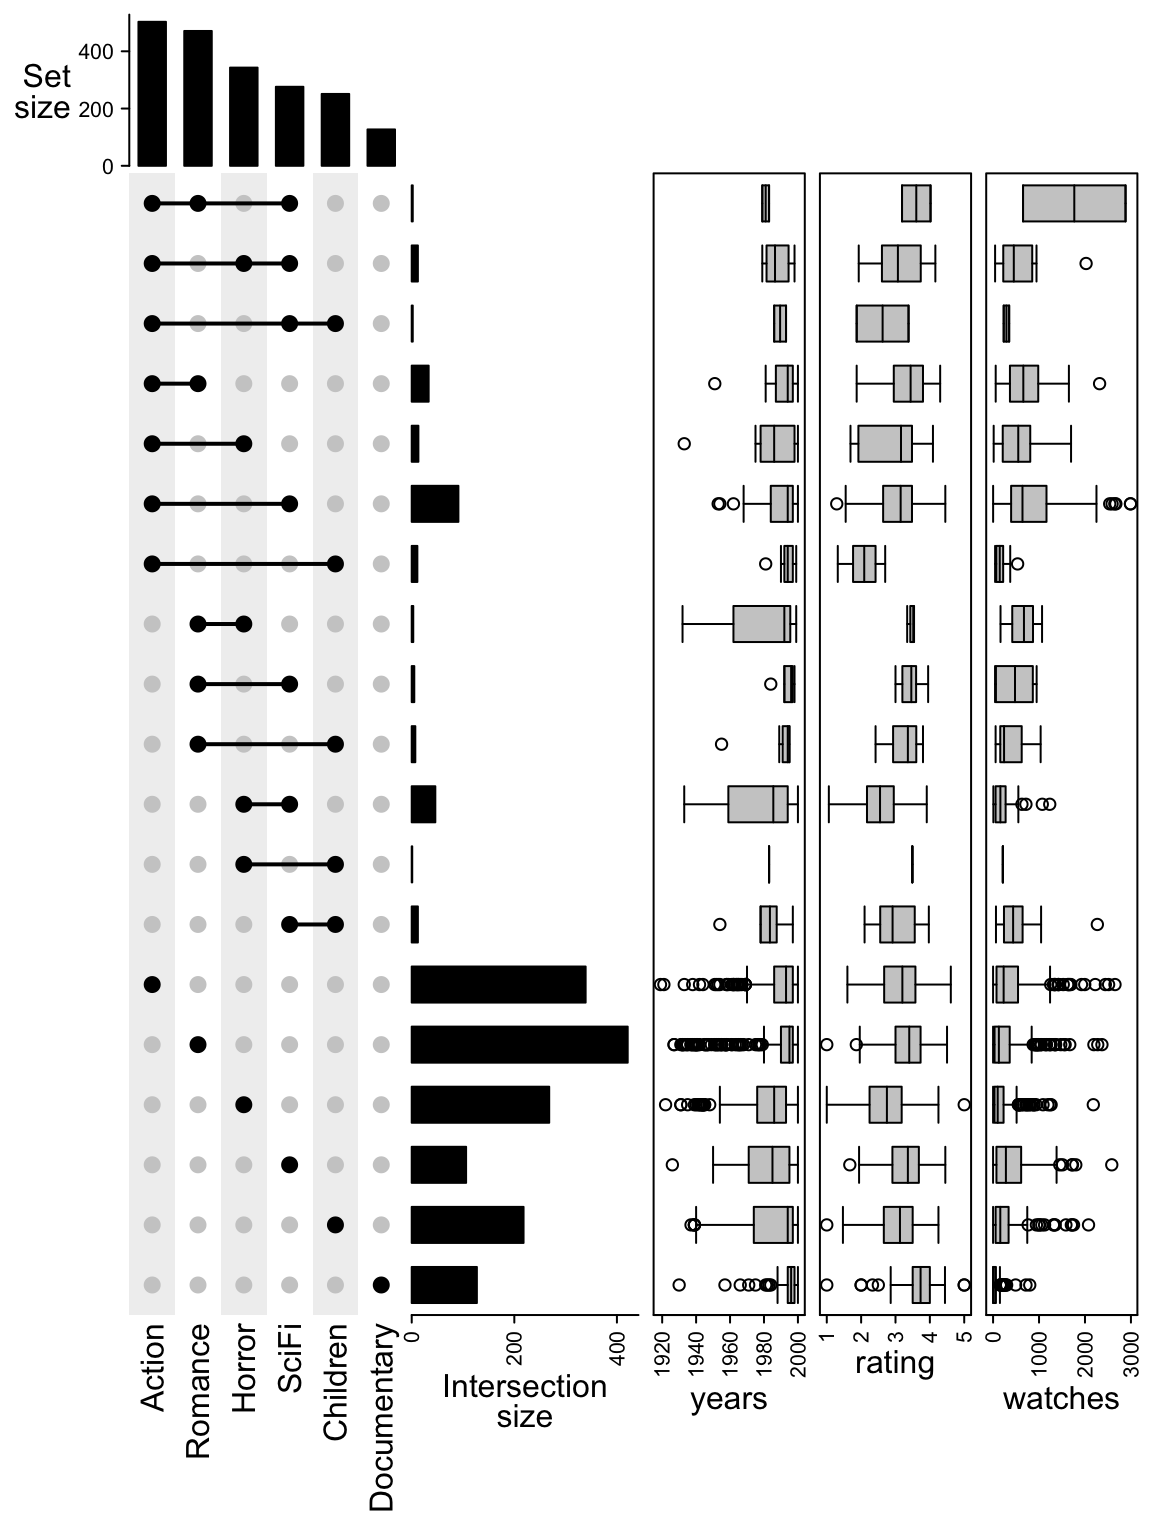
UpSet plot
3D heatmap
License
MIT @ Zuguang Gu