📊 The concise and progressive visualization grammar.
 English | 简体中文
G2: The Concise and Progressive Visualization Grammar
G2 is a visualization grammar for dashboard building, data exploration and storytelling.






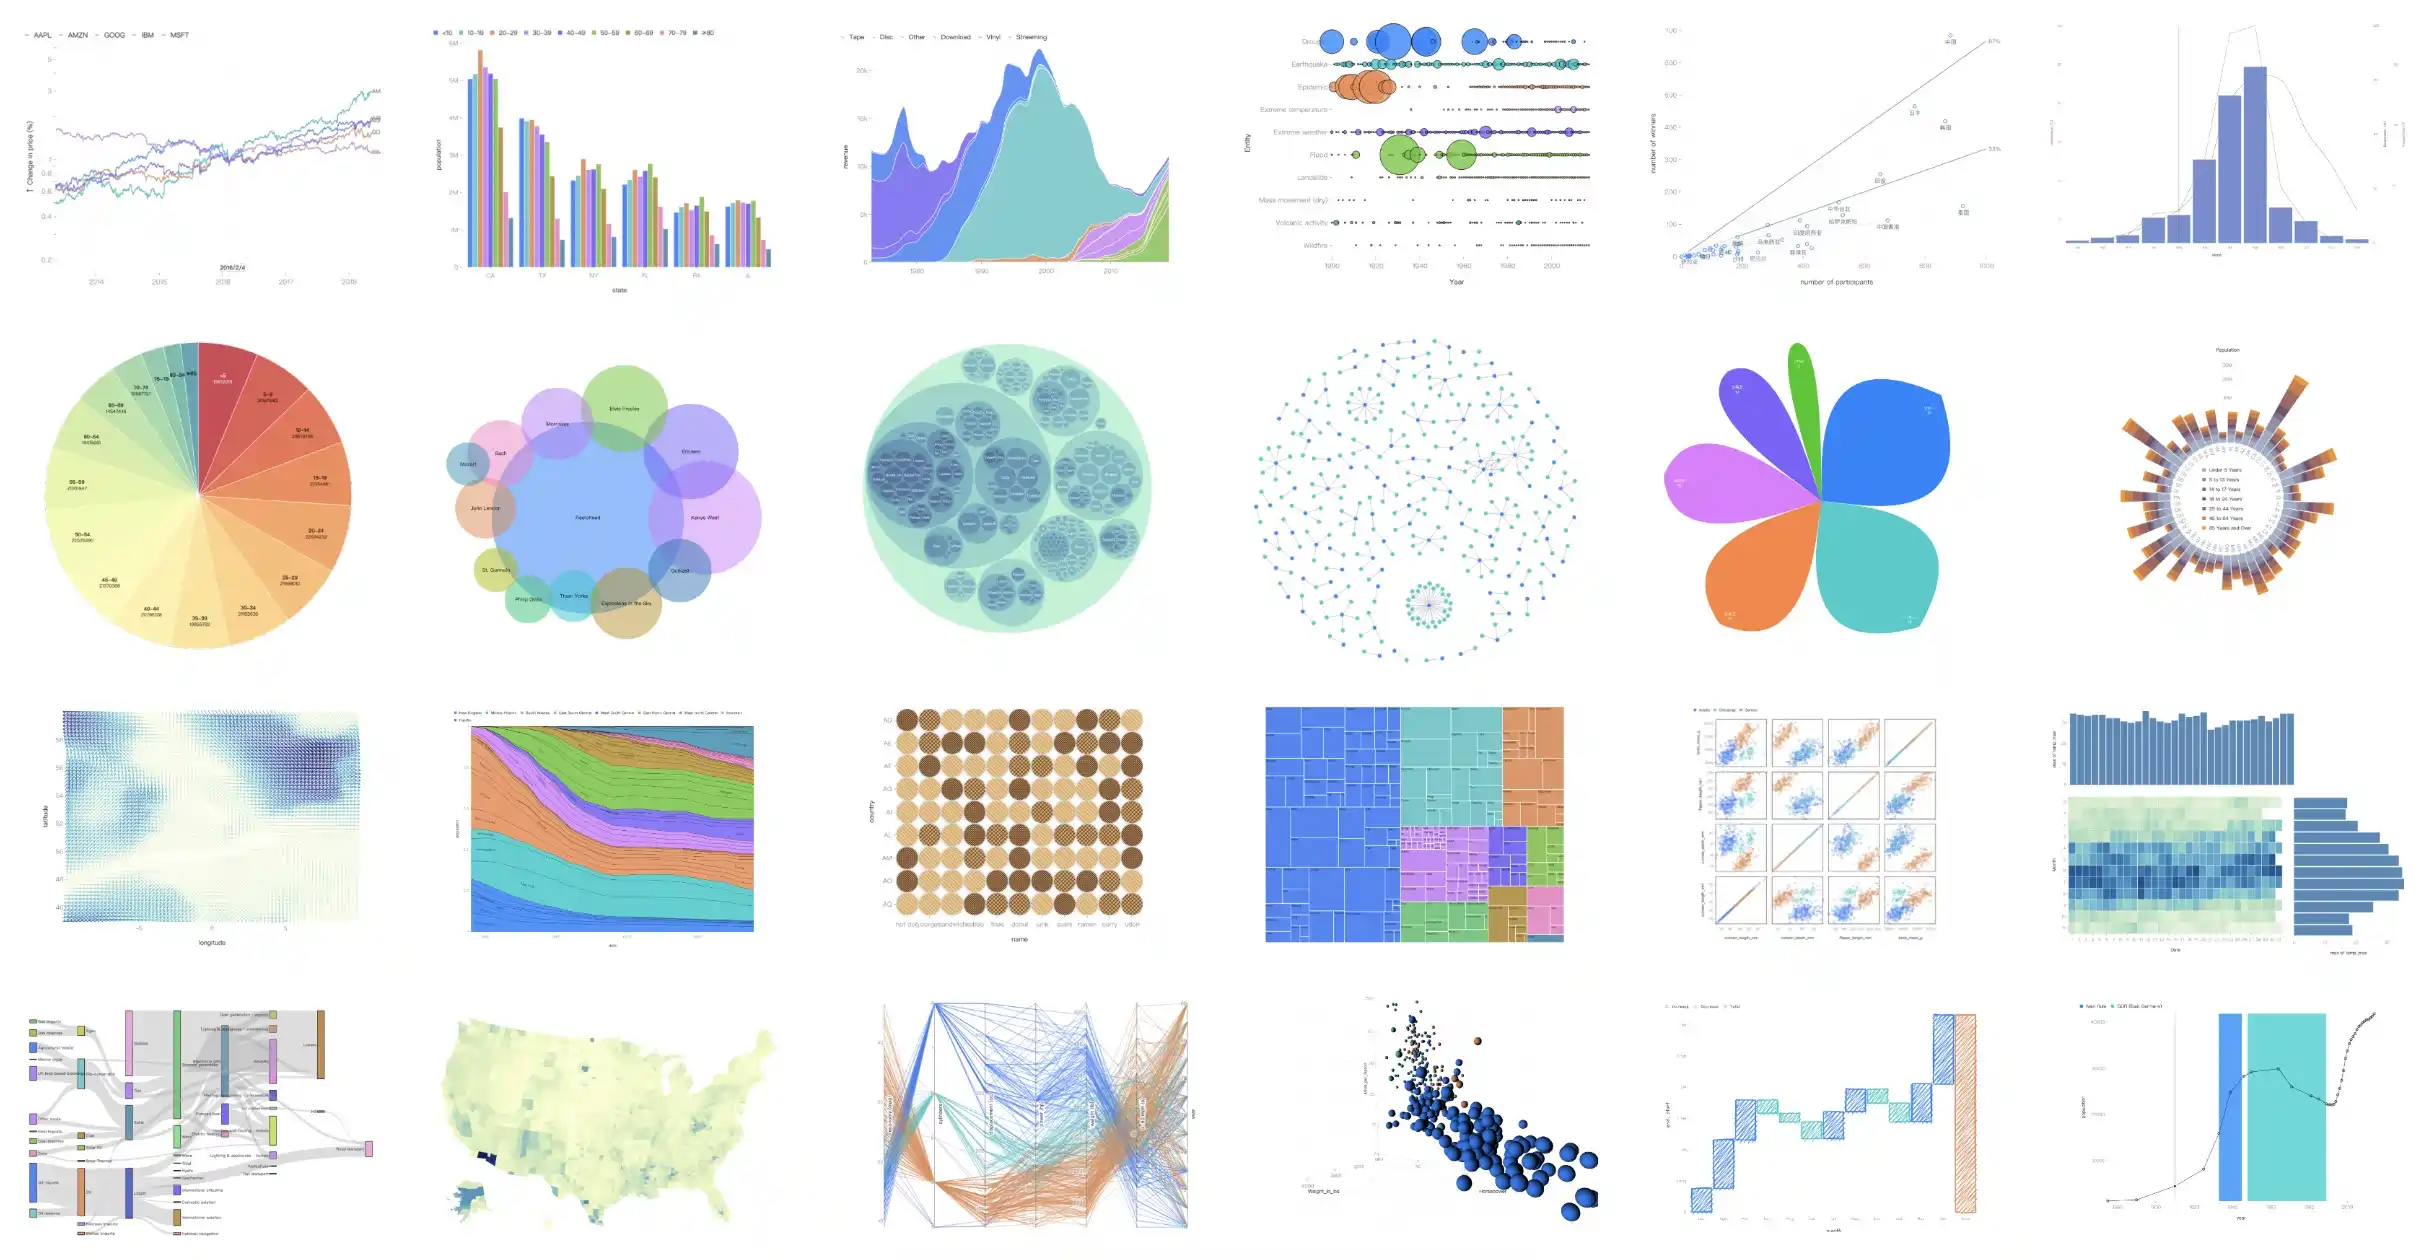
G2 is named after Leland Wilkinson’s book The Grammar of Graphics and was profoundly inspired by it in the very beginning. Here are some resources you can begin with:
- Introduction - a brief overview and G2's motivations
- Examples - a large number of demos to learn from and copy-paste
- Tutorials - interactive case-driven guides of G2's core concepts
- API Reference - complete documentation for all visualization components
✨ Features
- Progressive Usage - The main objective of G2 is to help you get meaningful visualizations quickly with concise declarations and it infers the rest. But you can configure much more for complex and advanced situations.
- Declarative API - We employs a functional declarative API to specify chart options in a programmatic fashion, which contributes to better logic reuse and more flexible code organization.
- High Extensibility - To satisfy specific needs, G2 provides a convenient and consistent mechanism to extend everything you can imagine, whether a scale, a transform, a mark, etc,. You can even customize a brand new visualization tool based on this mechanism.
- Comprehensive Grammar - G2 rejects a chart typology in favor of marks, transforms, scales, coordinates, and compositions. In addition to static visual representations, it's possible to declare data-driven animations and apply well-designed action-based interactions to plots as well.
- Powerful Renderer - There is a powerful renderer G under G2 to generate web-based visualizations using Canvas, SVG or WebGL. The plenty of plugins it has benefit G2 from rendering charts with novel styles such as hand-drawn and fully embracing the ecosystem of D3.
🔨 Getting Started
G2 is usually installed via a package manager such as npm or Yarn.
$ npm install @antv/g2
$ yarn add @antv/g2
The Chart object then can be imported from G2.
<div id="container"></div>
import { Chart } from '@antv/g2';

// A tabular data to be visualized.
const data = [
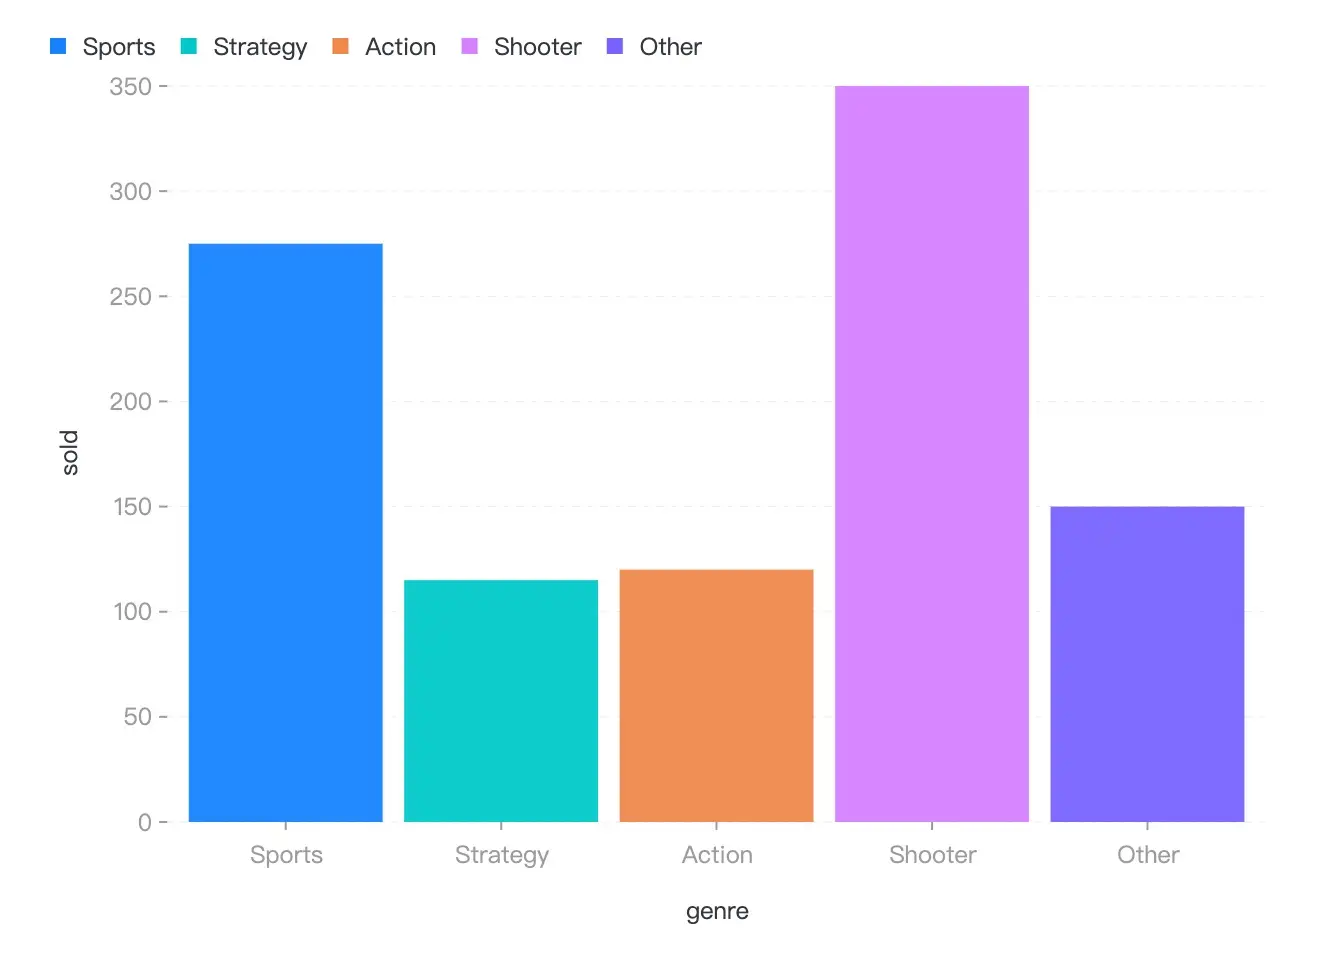
  { genre: 'Sports', sold: 275 },
  { genre: 'Strategy', sold: 115 },
  { genre: 'Action', sold: 120 },
  { genre: 'Shooter', sold: 350 },
  { genre: 'Other', sold: 150 },
];

// Instantiate a new chart.
const chart = new Chart({
  container: 'container',
});

// Specify visualization.
chart
  .interval() // Create an interval mark and add it to the chart.
  .data(data) // Bind data for this mark.
  .encode('x', 'genre') // Assign genre column to x position channel.
  .encode('y', 'sold') // Assign sold column to y position channel.
  .encode('color', 'genre'); // Assign genre column to color channel.

// Render visualization.
chart.render();
If all goes well, you can get the following lovely bar chart!
🌍 Ecosystem
- g2-react - The lightweight React component for G2, without extra features.
- g2-extensions - The one-stop shop for official G2 extensions, such as 3d visualization, automated visual analytics, etc.
- ant-design-charts - The React chart library, based on G2, G6, X6, L7Plot.
- More...
📮 Contributing
This project exists thanks to all the people who contribute.
And thank you to all our backers! 🙏
- Issues - report bugs or request features
- Contributing Guide - help build G2
- Discussions - discuss on GitHub or in DingTalk group(30233731, 35686967, 44788198)

📑 Paper
Bairui Su, Zhiwei Wang, Zhifeng Lin, Xiaojuan Liao, Zihan Zhou, Minfeng Zhu, Wei Chen. G2: A customizable web-based framework for authoring interactive visualizations. Visual Informatics, 2026.
@article{su2026g2,
  author={Bairui Su, Zhiwei Wang, Zhifeng Lin, Xiaojuan Liao, Zihan Zhou, Minfeng Zhu, Wei Chen},
  title={G2: A customizable web-based framework for authoring interactive visualizations},
  journal={Visual Informatics},
  year={2026},
  url={https://doi.org/10.1016/j.visinf.2026.100307}
}
📄 License
MIT@AntV.