Nightingale is to monitoring and alerting what Grafana is to visualization.
go get github.com/ccfos/nightingale

Open-Source Alerting Expert










🎯 What is Nightingale
Nightingale is an open-source monitoring project that focuses on alerting. Similar to Grafana, Nightingale also connects with various existing data sources. However, while Grafana emphasizes visualization, Nightingale places greater emphasis on the alerting engine, as well as the processing and distribution of alarms.
💡 Nightingale has now officially launched the MCP-Server. This MCP Server enables AI assistants to interact with the Nightingale API using natural language, facilitating alert management, monitoring, and observability tasks.
The Nightingale project was initially developed and open-sourced by DiDi.inc. On May 11, 2022, it was donated to the Open Source Development Committee of the China Computer Federation (CCF ODTC).
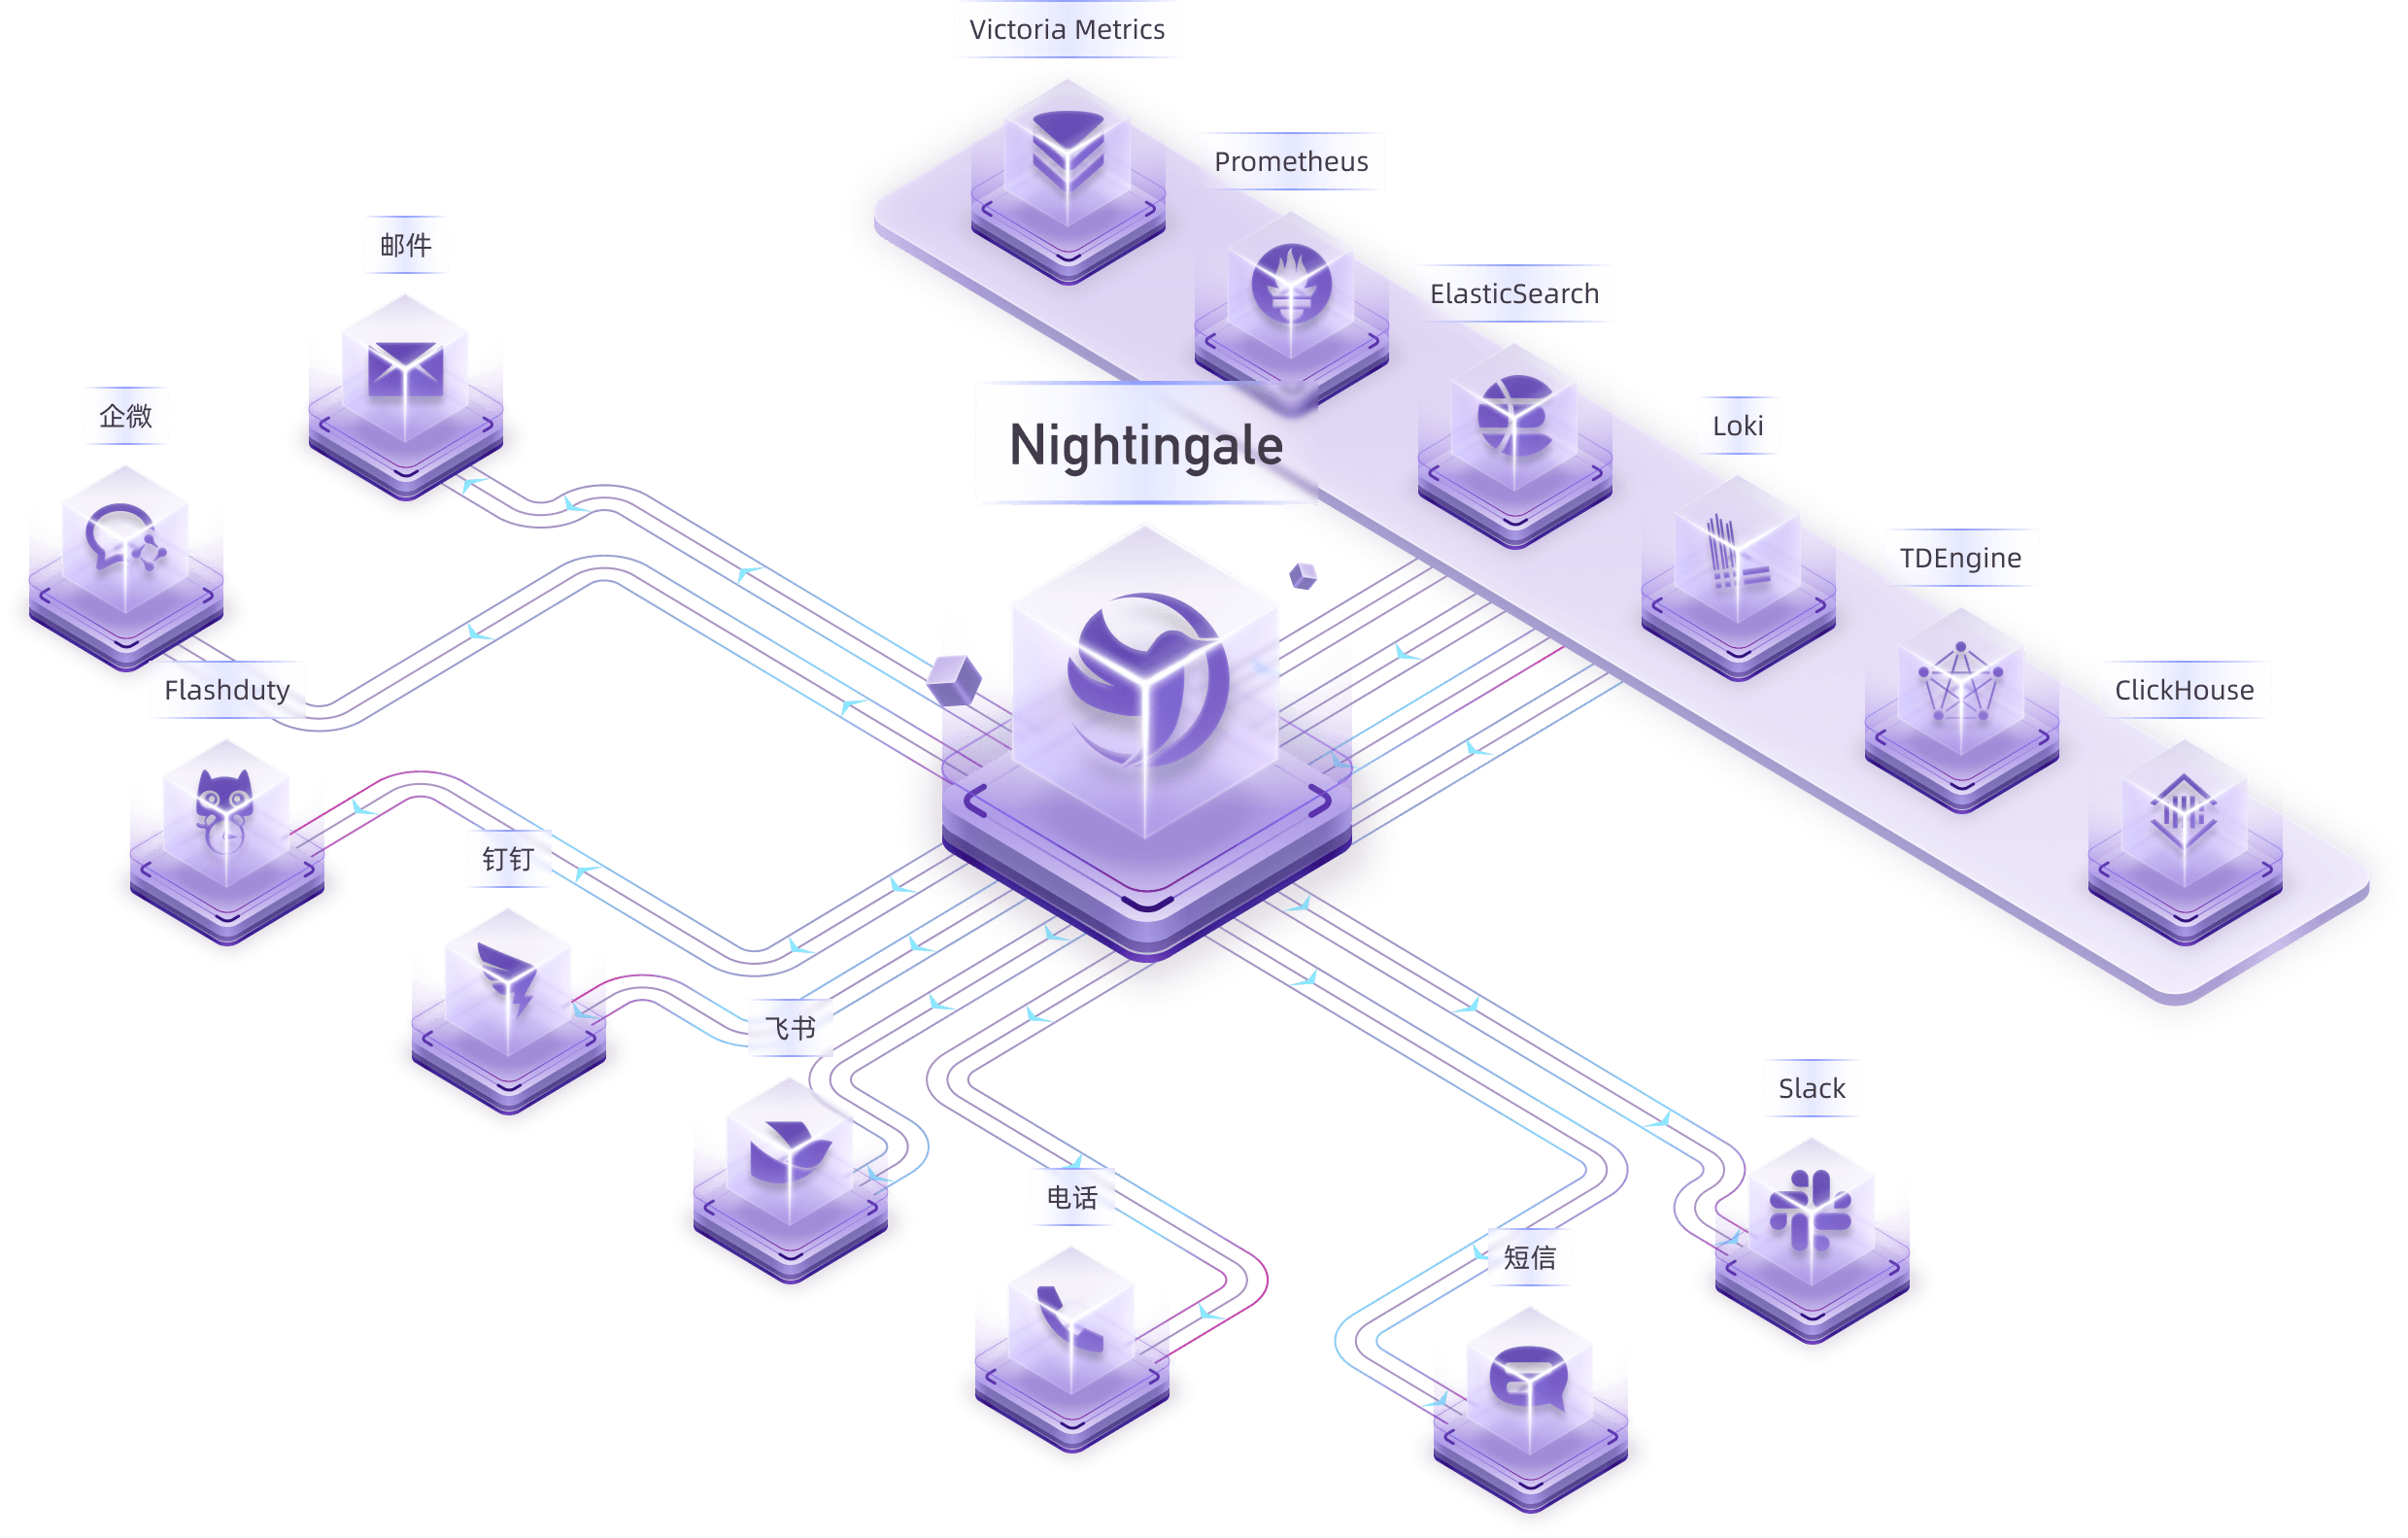
💡 How Nightingale Works
Many users have already collected metrics and log data. In this case, you can connect your storage repositories (such as VictoriaMetrics, ElasticSearch, etc.) as data sources in Nightingale. This allows you to configure alerting rules and notification rules within Nightingale, enabling the generation and distribution of alarms.

Nightingale itself does not provide monitoring data collection capabilities. We recommend using Categraf as the collector, which integrates seamlessly with Nightingale.
Categraf can collect monitoring data from operating systems, network devices, various middleware, and databases. It pushes this data to Nightingale via the Prometheus Remote Write protocol. Nightingale then stores the monitoring data in a time-series database (such as Prometheus, VictoriaMetrics, etc.) and provides alerting and visualization capabilities.
For certain edge data centers with poor network connectivity to the central Nightingale server, we offer a distributed deployment mode for the alerting engine. In this mode, even if the network is disconnected, the alerting functionality remains unaffected.

In the above diagram, Data Center A has a good network with the central data center, so it uses the Nightingale process in the central data center as the alerting engine. Data Center B has a poor network with the central data center, so it deploys
n9e-edgeas the alerting engine to handle alerting for its own data sources.
🔕 Alert Noise Reduction, Escalation, and Collaboration
Nightingale focuses on being an alerting engine, responsible for generating alarms and flexibly distributing them based on rules. It supports 20 built-in notification medias (such as phone calls, SMS, email, DingTalk, Slack, etc.).
If you have more advanced requirements, such as:
- Want to consolidate events from multiple monitoring systems into one platform for unified noise reduction, response handling, and data analysis.
- Want to support personnel scheduling, practice on-call culture, and support alert escalation (to avoid missing alerts) and collaborative handling.
Then Nightingale is not suitable. It is recommended that you choose on-call products such as PagerDuty and FlashDuty. These products are simple and easy to use.
🗨️ Communication Channels
- Report Bugs: It is highly recommended to submit issues via the Nightingale GitHub Issue tracker.
- Documentation: For more information, we recommend thoroughly browsing the Nightingale Documentation Site.
🔑 Key Features

- Nightingale supports alerting rules, mute rules, subscription rules, and notification rules. It natively supports 20 types of notification media and allows customization of message templates.
- It supports event pipelines for Pipeline processing of alarms, facilitating automated integration with in-house systems. For example, it can append metadata to alarms or perform relabeling on events.
- It introduces the concept of business groups and a permission system to manage various rules in a categorized manner.
- Many databases and middleware come with built-in alert rules that can be directly imported and used. It also supports direct import of Prometheus alerting rules.
- It supports alerting self-healing, which automatically triggers a script to execute predefined logic after an alarm is generated—such as cleaning up disk space or capturing the current system state.

- Nightingale archives historical alarms and supports multi-dimensional query and statistics.
- It supports flexible aggregation grouping, allowing a clear view of the distribution of alarms across the company.

- Nightingale has built-in metric descriptions, dashboards, and alerting rules for common operating systems, middleware, and databases, which are contributed by the community with varying quality.
- It directly receives data via multiple protocols such as Remote Write, OpenTSDB, Datadog, and Falcon, integrates with various Agents.
- It supports data sources like Prometheus, ElasticSearch, Loki, ClickHouse, MySQL, Postgres, allowing alerting based on data from these sources.
- Nightingale can be easily embedded into internal enterprise systems (e.g. Grafana, CMDB), and even supports configuring menu visibility for these embedded systems.

- Nightingale supports dashboard functionality, including common chart types, and comes with pre-built dashboards. The image above is a screenshot of one of these dashboards.
- If you are already accustomed to Grafana, it is recommended to continue using Grafana for visualization, as Grafana has deeper expertise in this area.
- For machine-related monitoring data collected by Categraf, it is advisable to use Nightingale's built-in dashboards for viewing. This is because Categraf's metric naming follows Telegraf's convention, which differs from that of Node Exporter.
- Due to Nightingale's concept of business groups (where machines can belong to different groups), there may be scenarios where you only want to view machines within the current business group on the dashboard. Thus, Nightingale's dashboards can be linked with business groups for interactive filtering.
🌟 Stargazers over time
🔥 Users

🤝 Community Co-Building
- ❇️ Please read the Nightingale Open Source Project and Community Governance Draft. We sincerely welcome every user, developer, company, and organization to use Nightingale, actively report bugs, submit feature requests, share best practices, and help build a professional and active open-source community.
- ❤️ Nightingale Contributors