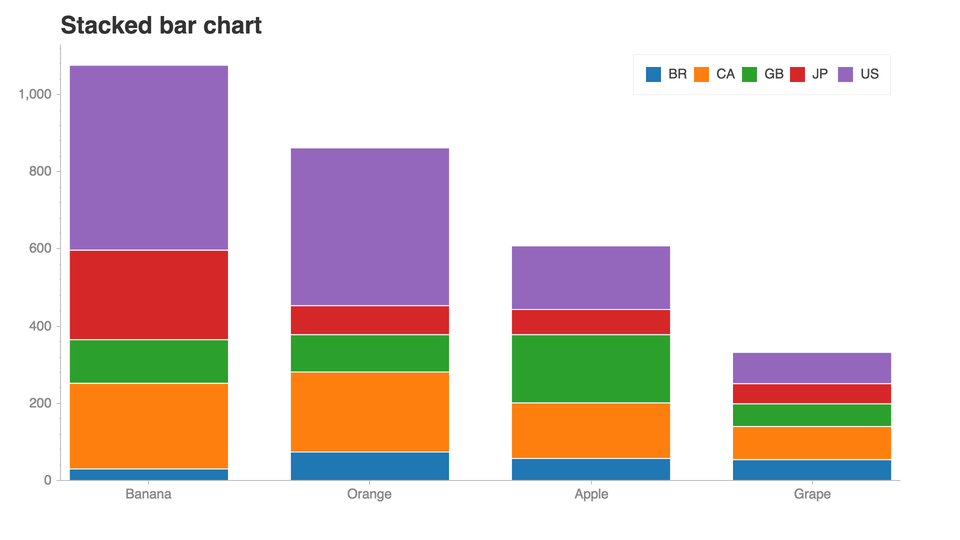
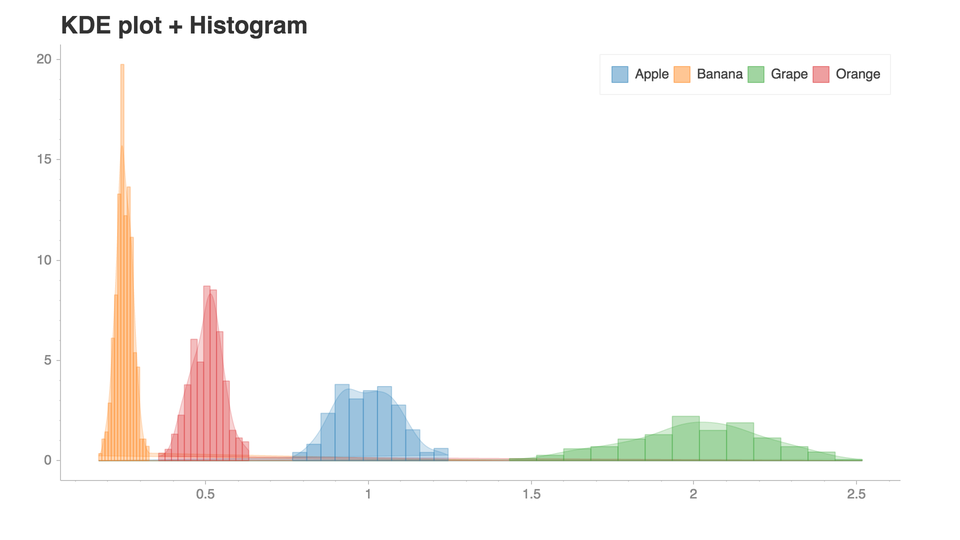
Python library that makes it easy for data scientists to create charts.
bokehvisualizationpythonplottingplotsdata-science
주요 지표
스타 성장
스타
3.6k
포크
332
주간 성장
—
이슈
44
1k2k3k
2018년 9월2019년 12월2021년 4월2022년 8월2023년 12월2025년 3월2026년 7월
아티팩트PyPIpip install chartify
README
Chartify
Chartify is a Python library that makes it easy for data scientists to create charts.
Why use Chartify?
Consistent input data format: Spend less time transforming data to get your charts to work. All plotting functions use a consistent tidy input data format.
Smart default styles: Create pretty charts with very little customization required.
Simple API: We've attempted to make the API as intuitive and easy to learn as possible.
Flexibility: Chartify is built on top of Bokeh, so if you do need more control you can always fall back on Bokeh's API.