Visualize Erlang/Elixir Nodes On The Command Line
observer_cli




Production-ready BEAM diagnostics for operators, automation, and AI agents.
observer_cli inspects live Erlang and Elixir systems through two explicit
interfaces. The command CLI is the recommended starting point for bounded,
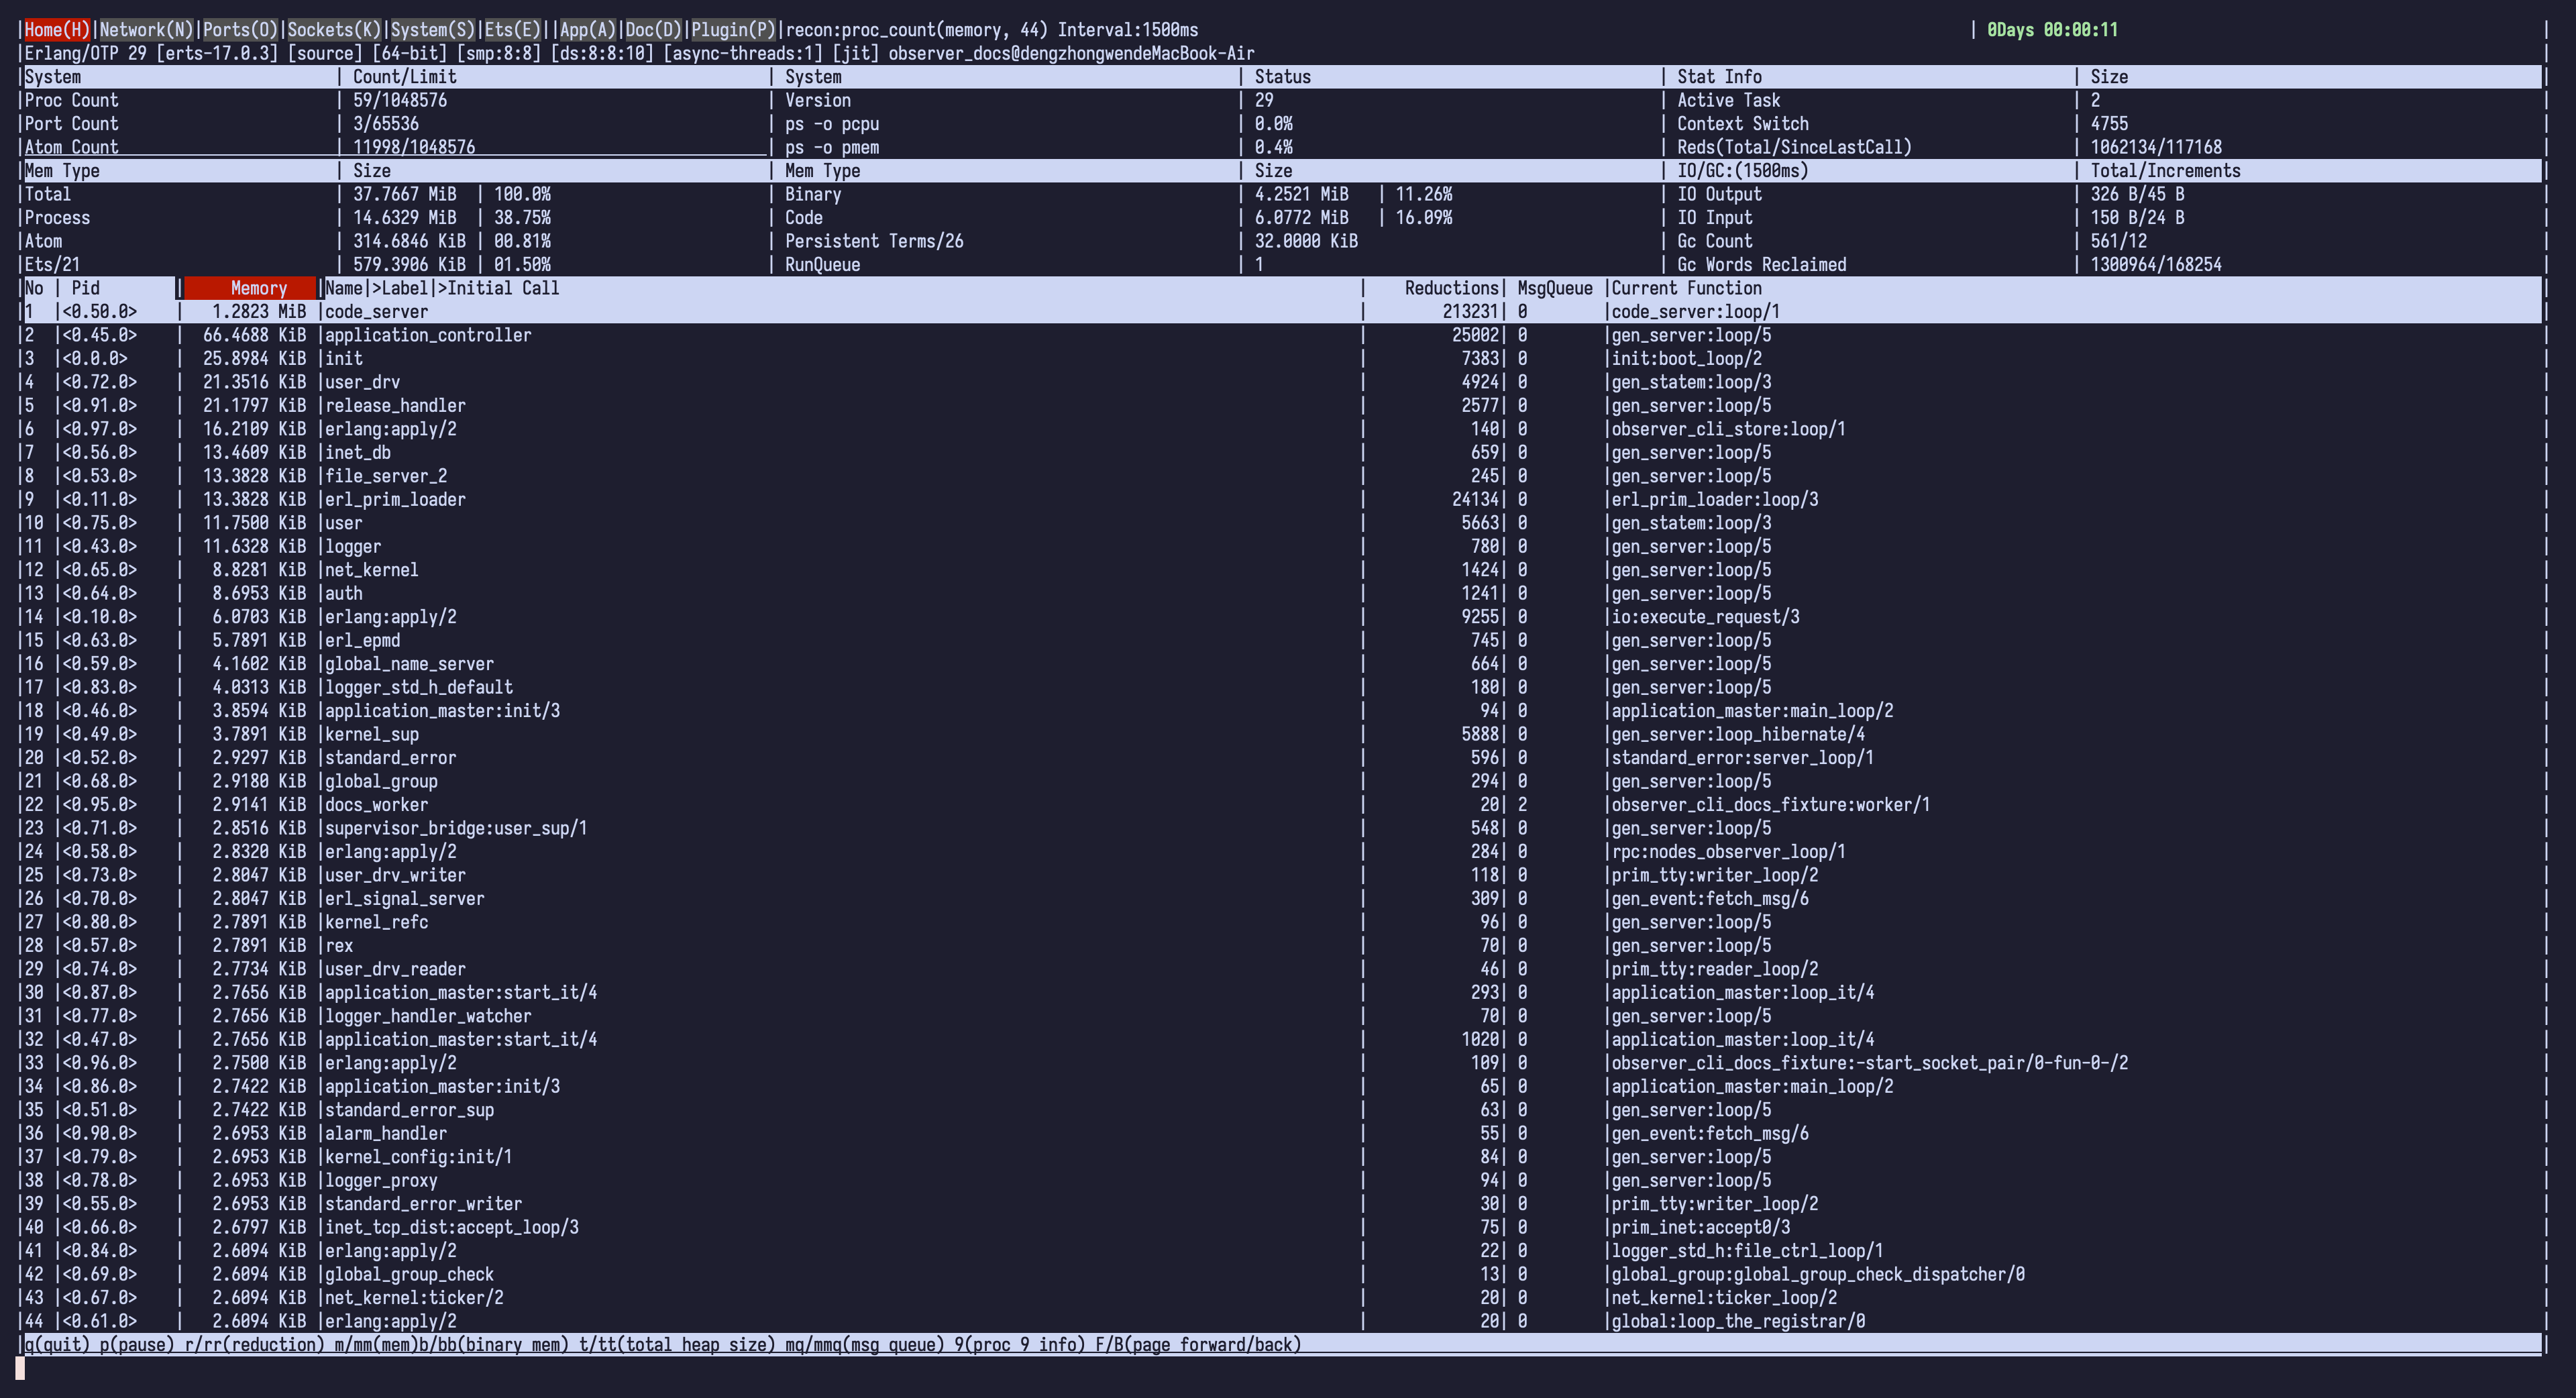
repeatable diagnostics with stable text, Erlang-term, or JSON output. The TUI
provides a live terminal workspace for interactive exploration.
Both interfaces use Erlang distribution. Connect only to trusted nodes over a trusted network: a distribution cookie is not a read-only credential.
Installation
Install observer_cli in the target release so command diagnostics can run
there. Version 2.0 controllers require the matching 2.0.0 target bundle.
Observer CLI 2.0 supports Erlang/OTP 26–29. JSON output requires OTP 27 or
newer on the controller; text and Erlang-term output work across the supported
range.
Erlang
Add the dependency to rebar.config:
{deps, [
    {observer_cli, "2.0.0"}
]}.
Fetch and compile it:
rebar3 compile
Elixir
Add the dependency to mix.exs:
defp deps do
  [
    {:observer_cli, "2.0.0"}
  ]
end
Fetch and compile it:
mix deps.get
mix compile
Get started
Release downloads are prebuilt escripts, not standalone native binaries. They
require Erlang/OTP and escript on the controller. The command CLI still
requires the matching observer_cli version in the target release; TUI
auto-load also requires the controller and target to use the same OTP major.
Download a GitHub Release (recommended)
On macOS or Linux, the versioned installer selects the escript for the local OTP major, verifies its release checksum, and installs it for the current user:
curl -fsSL https://raw.githubusercontent.com/zhongwencool/observer_cli/v2.0.0/install.sh | sh
Add $HOME/.local/bin to PATH if the installer asks you to.
Build from source
Build the same version from its release tag instead:
VERSION=2.0.0
git clone --branch "v${VERSION}" --depth 1 \
  https://github.com/zhongwencool/observer_cli.git
cd observer_cli
Rebar3
rebar3 escriptize
BIN=./_build/default/bin/observer_cli
Mix
The CI-tested toolchain is Erlang/OTP 29 with Elixir 1.20:
mix deps.get
mix escript.build
BIN=./observer_cli
mkdir -p "$HOME/.local/bin"
install -m 0755 "$BIN" "$HOME/.local/bin/observer_cli"
export PATH="$HOME/.local/bin:$PATH"
observer_cli --version
Save a target without storing its cookie value:
export OBSERVER_CLI_COOKIE='replace-me'

observer_cli connect \
  --node app@host \
  --cookie-env OBSERVER_CLI_COOKIE
observer_cli status
observer_cli diagnose
observer_cli disconnect
connect stores a target selector, not a persistent connection. Every remote
command starts a temporary hidden controller, performs bounded work, validates
the response, and stops the controller before returning.
What you can do
- Diagnose capacity pressure with calibrated findings and explicit probe coverage.
- Inspect memory, allocators, schedulers, distribution, and network activity.
- Rank processes, applications, ETS tables, Mnesia tables, ports, and sockets.
- Inspect one process, Erlang port, supervision tree, or bounded OTP state.
- Read a bounded tail from one trusted plain
logger_std_hconfigured file without flushing Logger or accepting an arbitrary path. - Capture one exact, bounded function trace with explicit node-global consent.
- Feed automation and agents a versioned
observer_cli.cli/v1envelope with stable exit statuses. - Explore the same node interactively through detailed TUI pages and plugins.
The normative machine-readable response contract is published as
priv/schema/observer_cli.cli.v1.schema.json.
Choose CLI or TUI
| Interface | Choose it for | Start it with |
|---|---|---|
| CLI — recommended | Production runbooks, automation, incident capture, and AI-agent workflows | observer_cli diagnose |
| TUI | Live exploration, ranking changes, and detail drill-down | observer_cli tui app@host |
The CLI requires observer_cli 2.0.0 in the target release and does not inject
missing diagnostic code. The TUI can load its matching interactive bundle on a
trusted target before starting. The old bare
observer_cli NODE [COOKIE REFRESH_MS] form is not supported; use the explicit
tui command.
TUI auto-load sends controller-compiled BEAM bytecode to the target without recompiling it. Build the controller on the same OTP major as the target when auto-load is needed; cross-major bytecode loading is outside the supported compatibility contract.
observer_cli logs returns sensitive, untrusted retained text. It reads only a
selected handler's configured path, not the handler's private file descriptor
or rotation archives, and deliberately rejects redaction flags.
Upgrading from 1.x
Version 2.0 changes the TUI plugin callbacks and replaces positional plugin sorting. Follow the 1.x plugin migration table.
Next steps
- CLI: install both sides, connect, diagnose, automate, interpret output, and troubleshoot a complete first workflow.
- TUI reference: start the interface and look up every page, field, source, and shortcut.
- TUI plugins: add plugin sheets, row drill-down, and process formatters.
- Core concepts: understand execution, compatibility, diagnostic evidence, and safety boundaries.
The generated ExDoc site provides llms.txt, a Markdown version of every page,
and ExDoc's built-in Copy Markdown action. Build it locally with
rebar3 docs.