返回排行榜
spotify/chartify
PythonPython library that makes it easy for data scientists to create charts.
bokehvisualizationpythonplottingplotsdata-science
关键指标
Star 增长趋势
Star
3.6k
Forks
332
周增长
—
Issues
44
1k2k3k
2018年9月2019年12月2021年4月2022年8月2023年12月2025年3月2026年7月
制品库PyPI
pip install chartifyREADME
Chartify


Chartify is a Python library that makes it easy for data scientists to create charts.
Why use Chartify?
- Consistent input data format: Spend less time transforming data to get your charts to work. All plotting functions use a consistent tidy input data format.
- Smart default styles: Create pretty charts with very little customization required.
- Simple API: We've attempted to make the API as intuitive and easy to learn as possible.
- Flexibility: Chartify is built on top of Bokeh, so if you do need more control you can always fall back on Bokeh's API.
Examples
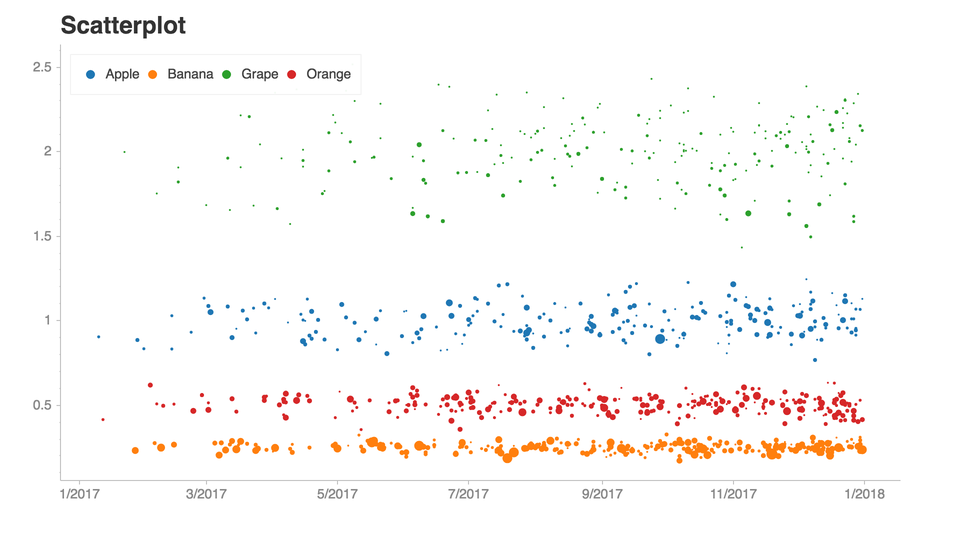
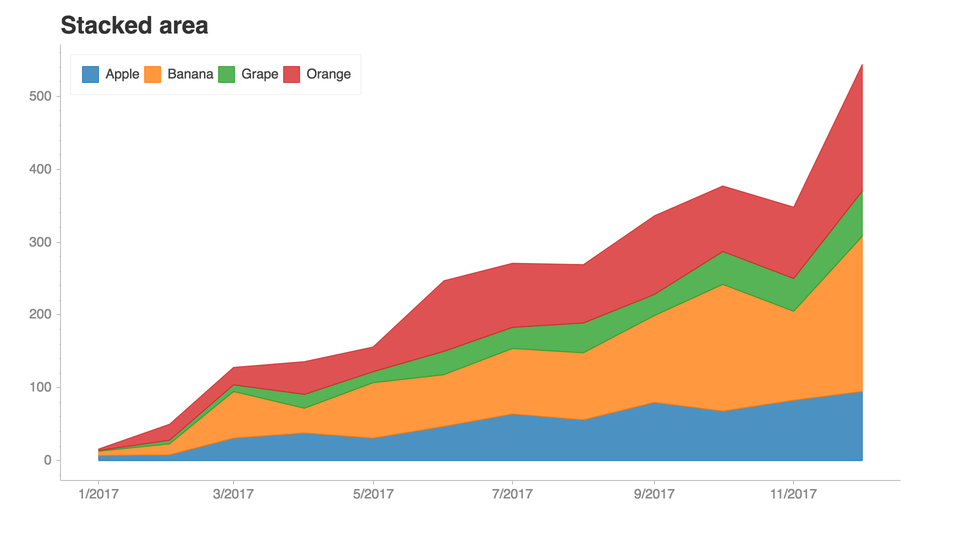
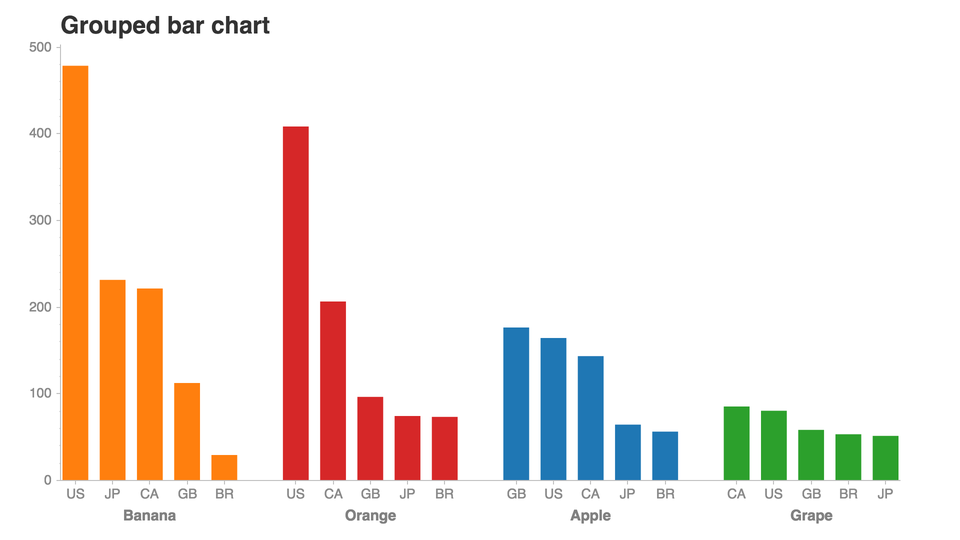
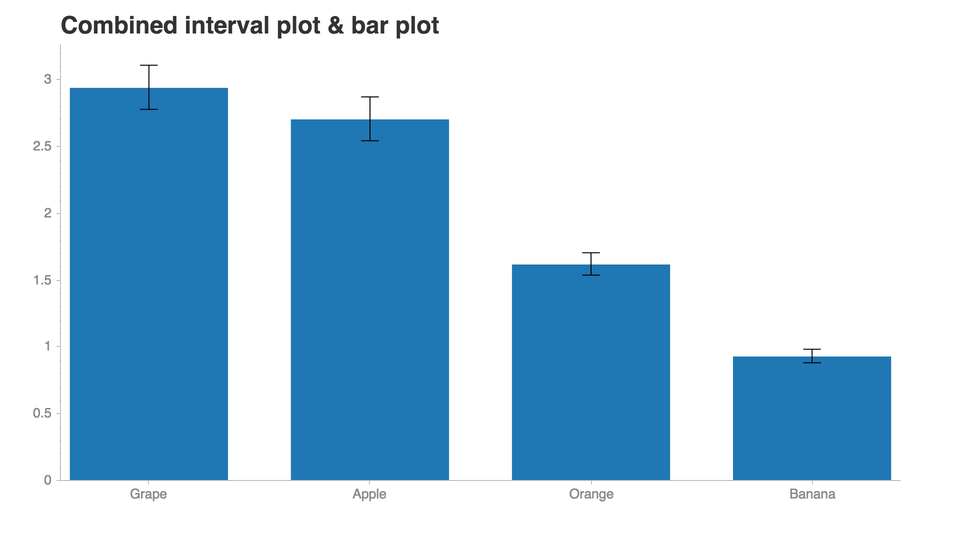
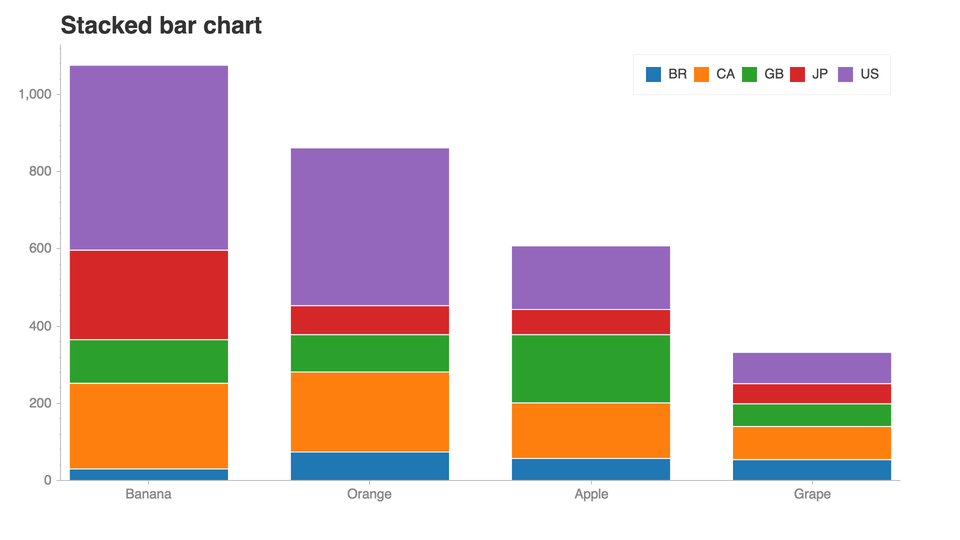
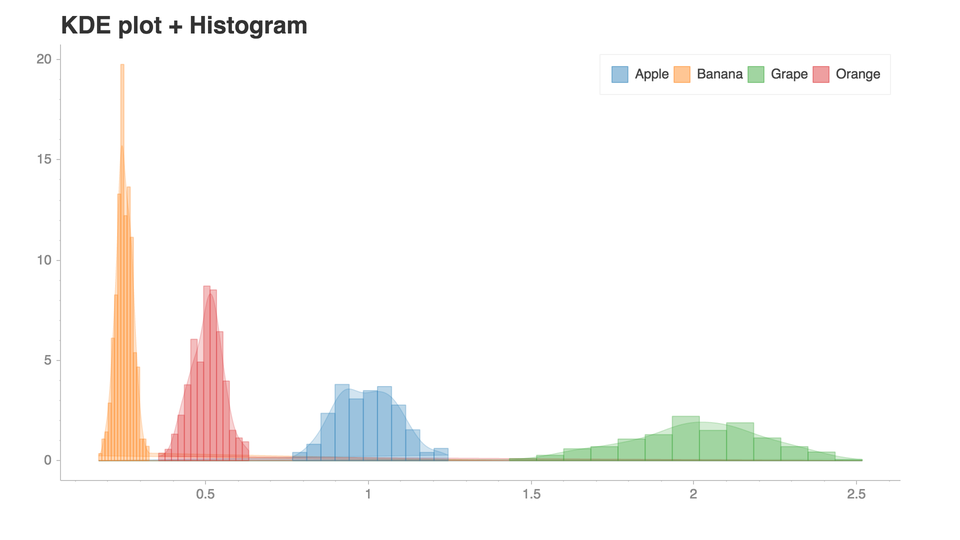
See this notebook for more examples!.
Installation
- Chartify can be installed via pip:
pip3 install chartify
- Install chromedriver requirement (Optional. Needed for PNG output):
- Install google chrome.
- Download the appropriate version of chromedriver for your OS here.
- Copy the executable file to a directory within your PATH.
- View directorys in your PATH variable:
echo $PATH - Copy chromedriver to the appropriate directory, e.g.:
cp chromedriver /usr/local/bin
Getting started
This tutorial notebook is the best place to get started with a guided tour of the core concepts of Chartify.
From there, check out the example notebook for a list of all the available plots.
Docs
Documentation available on chartify.readthedocs.io.
Getting support
Use the chartify tag on StackOverflow.
Code of Conduct
This project adheres to the Open Code of Conduct. By participating, you are expected to honor this code.
Contributing
相关仓库