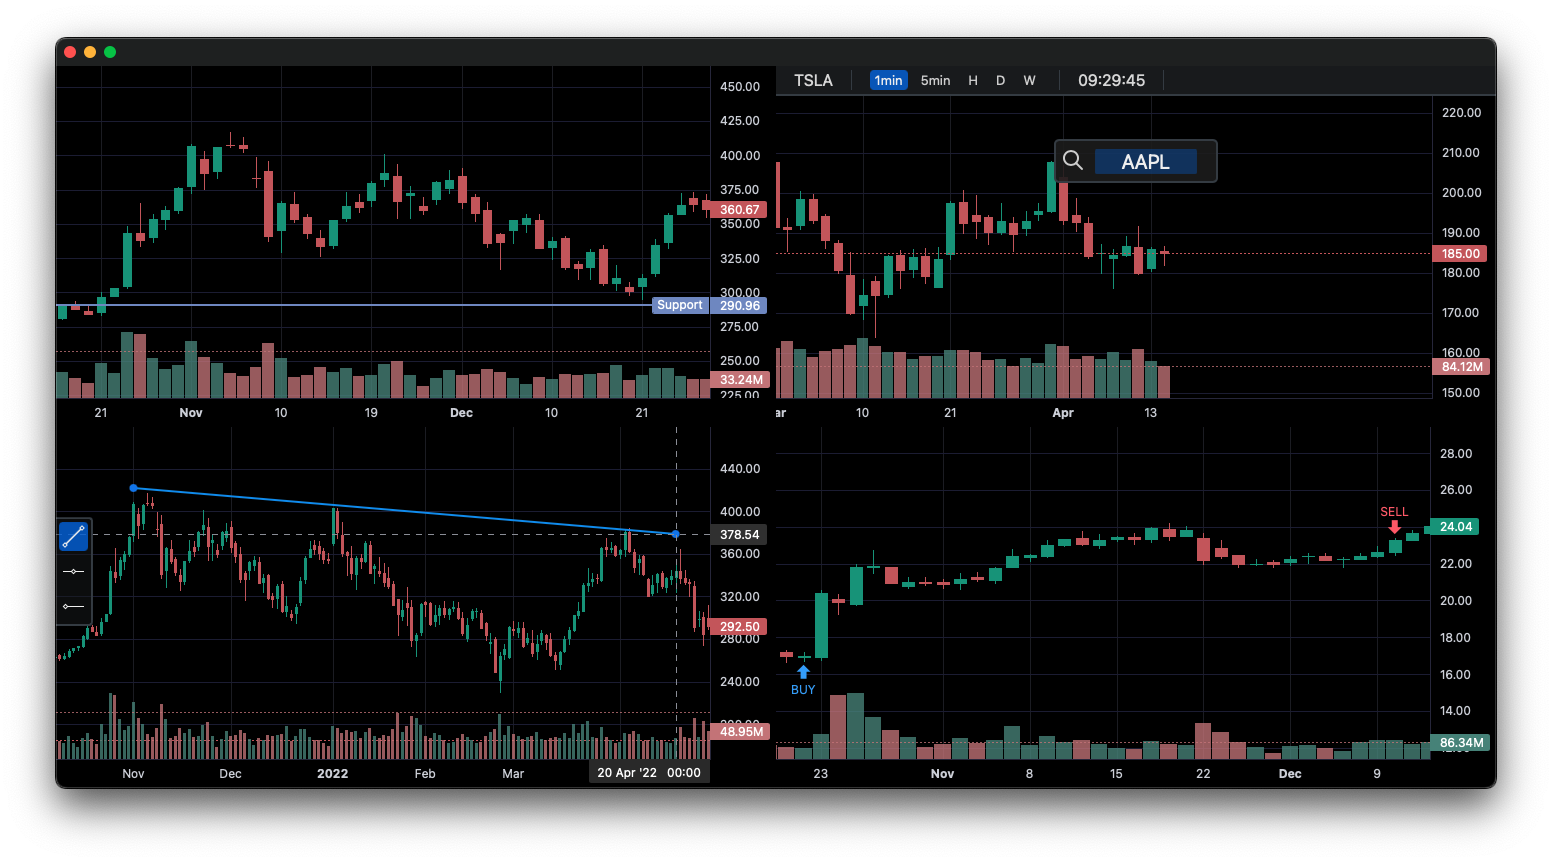
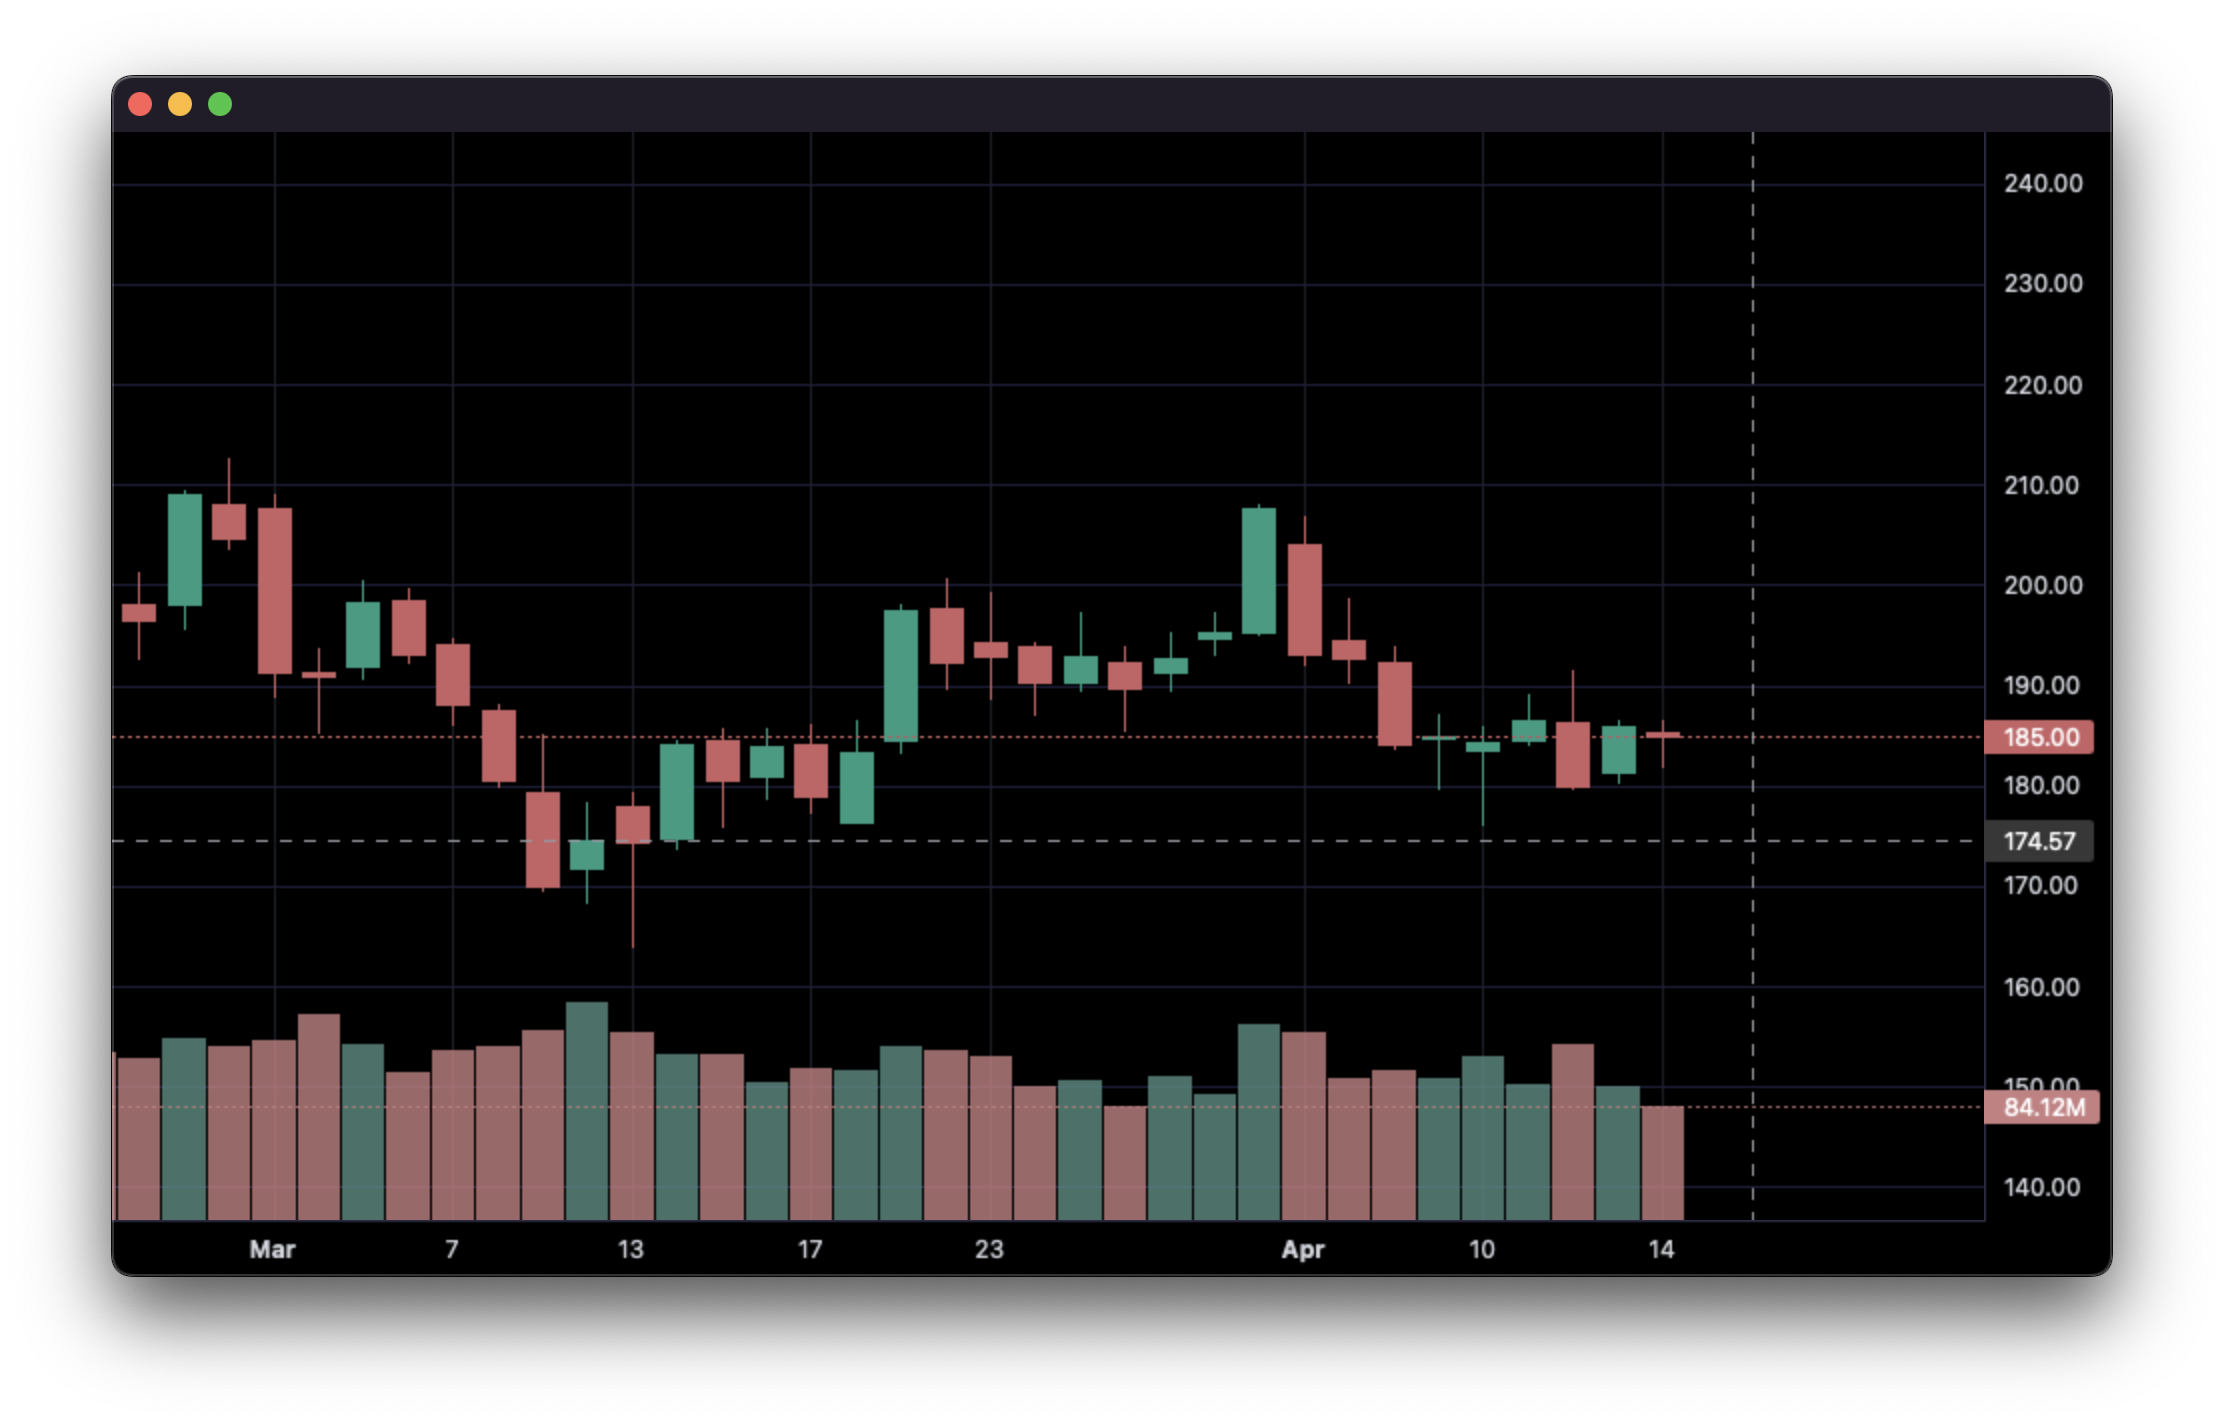
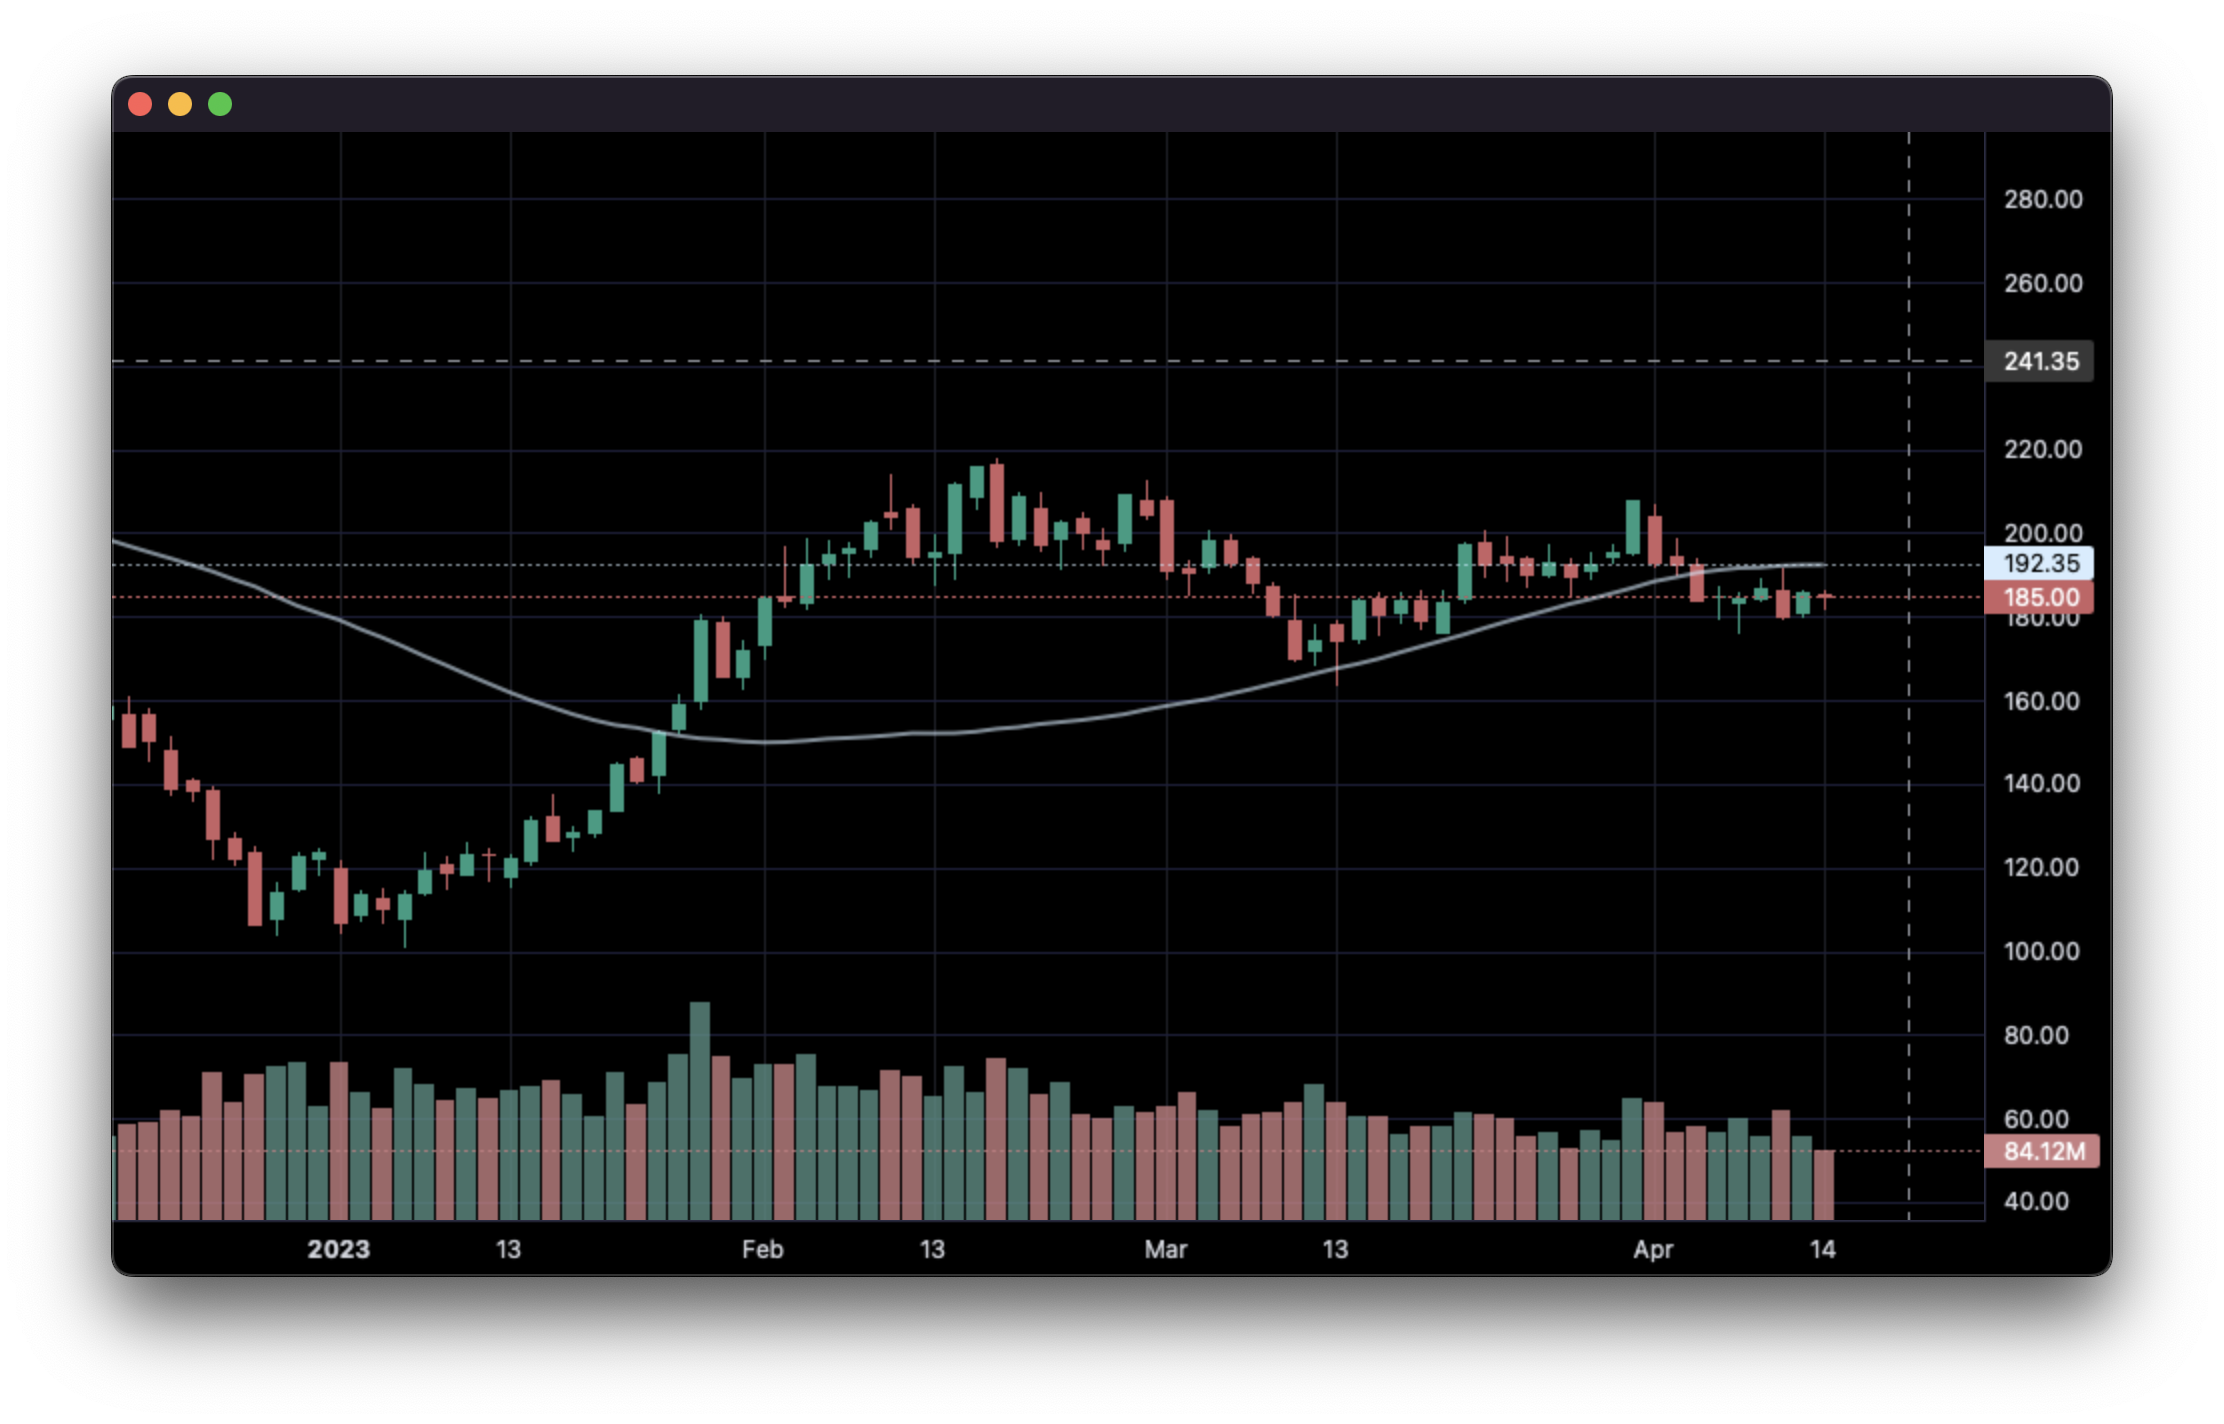
import pandas as pd
from lightweight_charts import Chart


if __name__ == '__main__':

    chart = Chart()

    # Columns: time | open | high | low | close | volume
    df = pd.read_csv('ohlcv.csv')
    chart.set(df)

    chart.show(block=True)
2. Updating bars in real-time:
import pandas as pd
from time import sleep
from lightweight_charts import Chart

if __name__ == '__main__':

    chart = Chart()

    df1 = pd.read_csv('ohlcv.csv')
    df2 = pd.read_csv('next_ohlcv.csv')

    chart.set(df1)

    chart.show()

    last_close = df1.iloc[-1]['close']

    for i, series in df2.iterrows():
        chart.update(series)

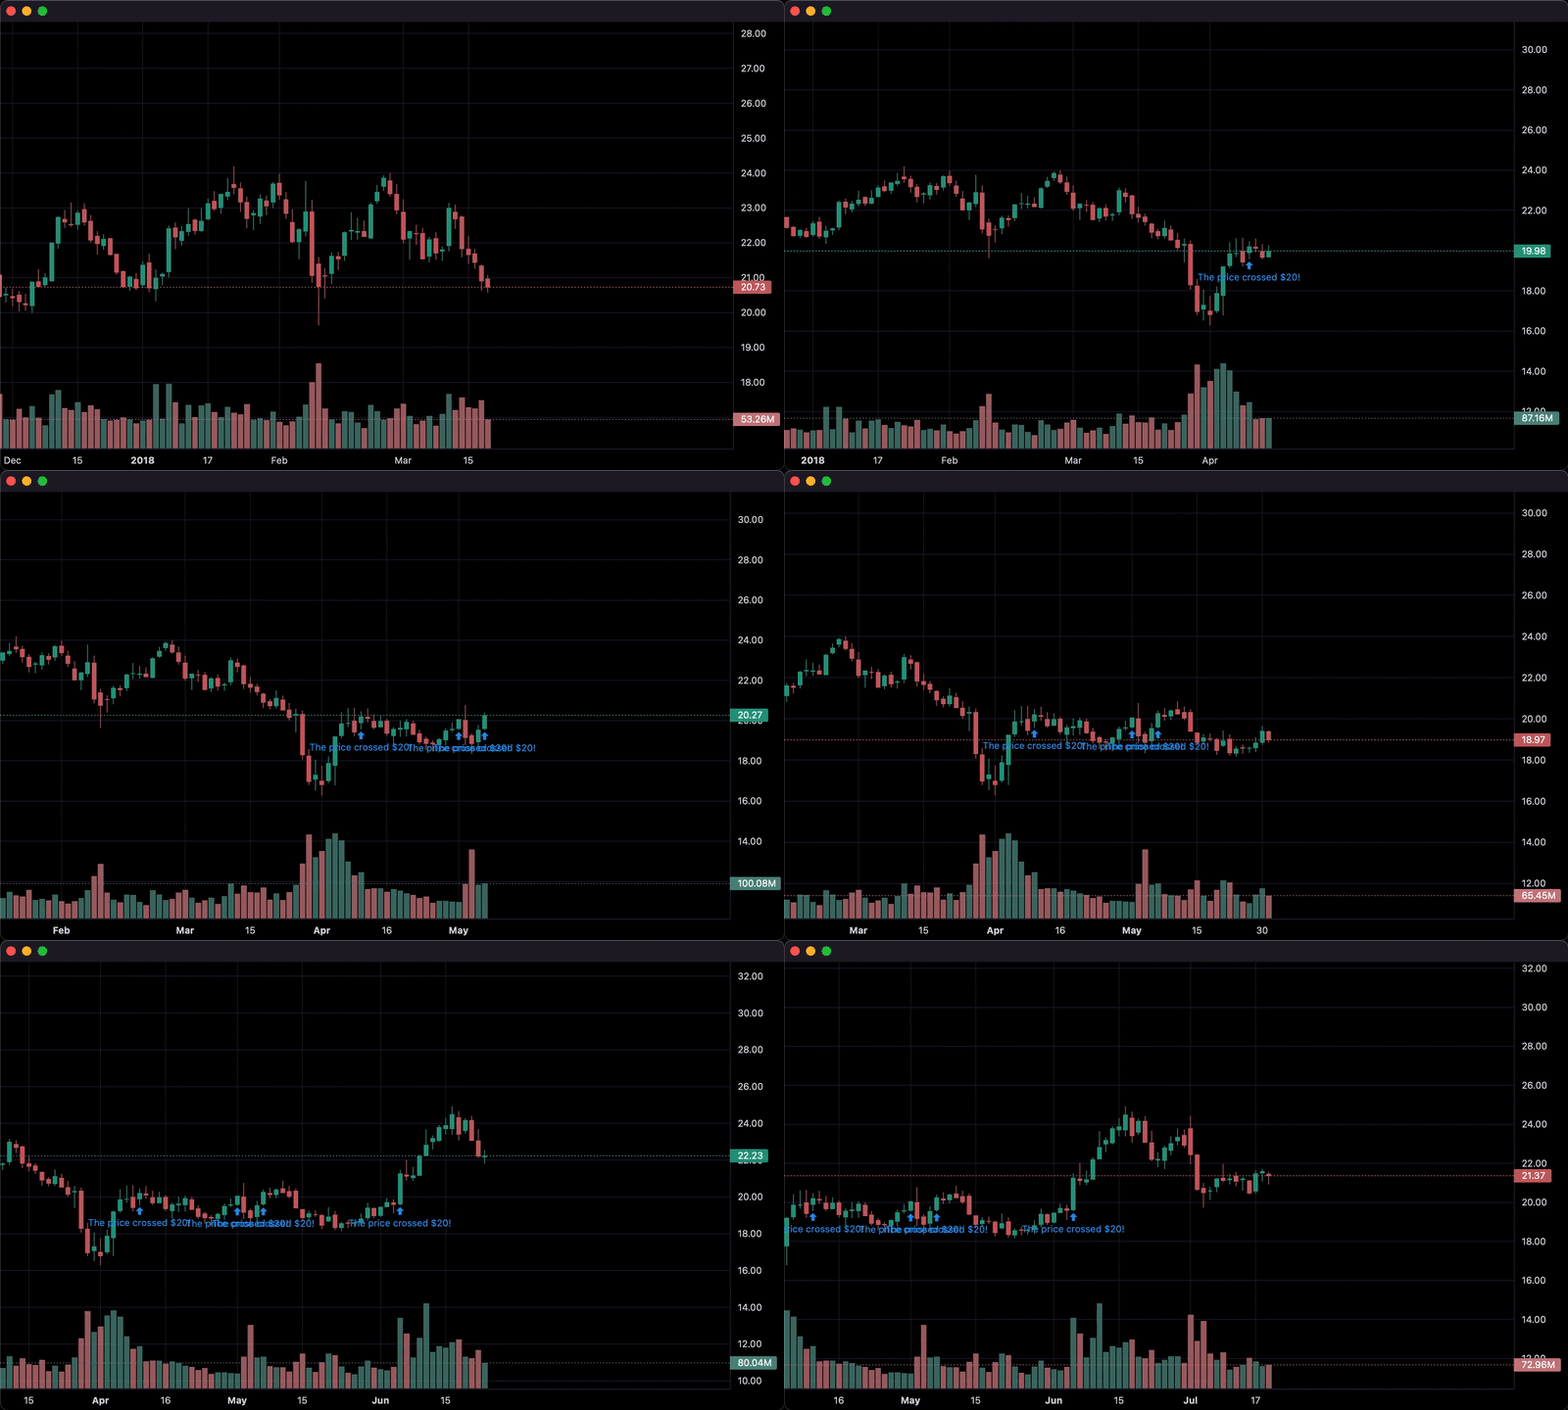
        if series['close'] > 20 and last_close < 20:
            chart.marker(text='The price crossed $20!')

        last_close = series['close']
        sleep(0.1)
3. Updating bars from tick data in real-time:
import pandas as pd
from time import sleep
from lightweight_charts import Chart


if __name__ == '__main__':

    df1 = pd.read_csv('ohlc.csv')

    # Columns: time | price
    df2 = pd.read_csv('ticks.csv')

    chart = Chart()

    chart.set(df1)

    chart.show()

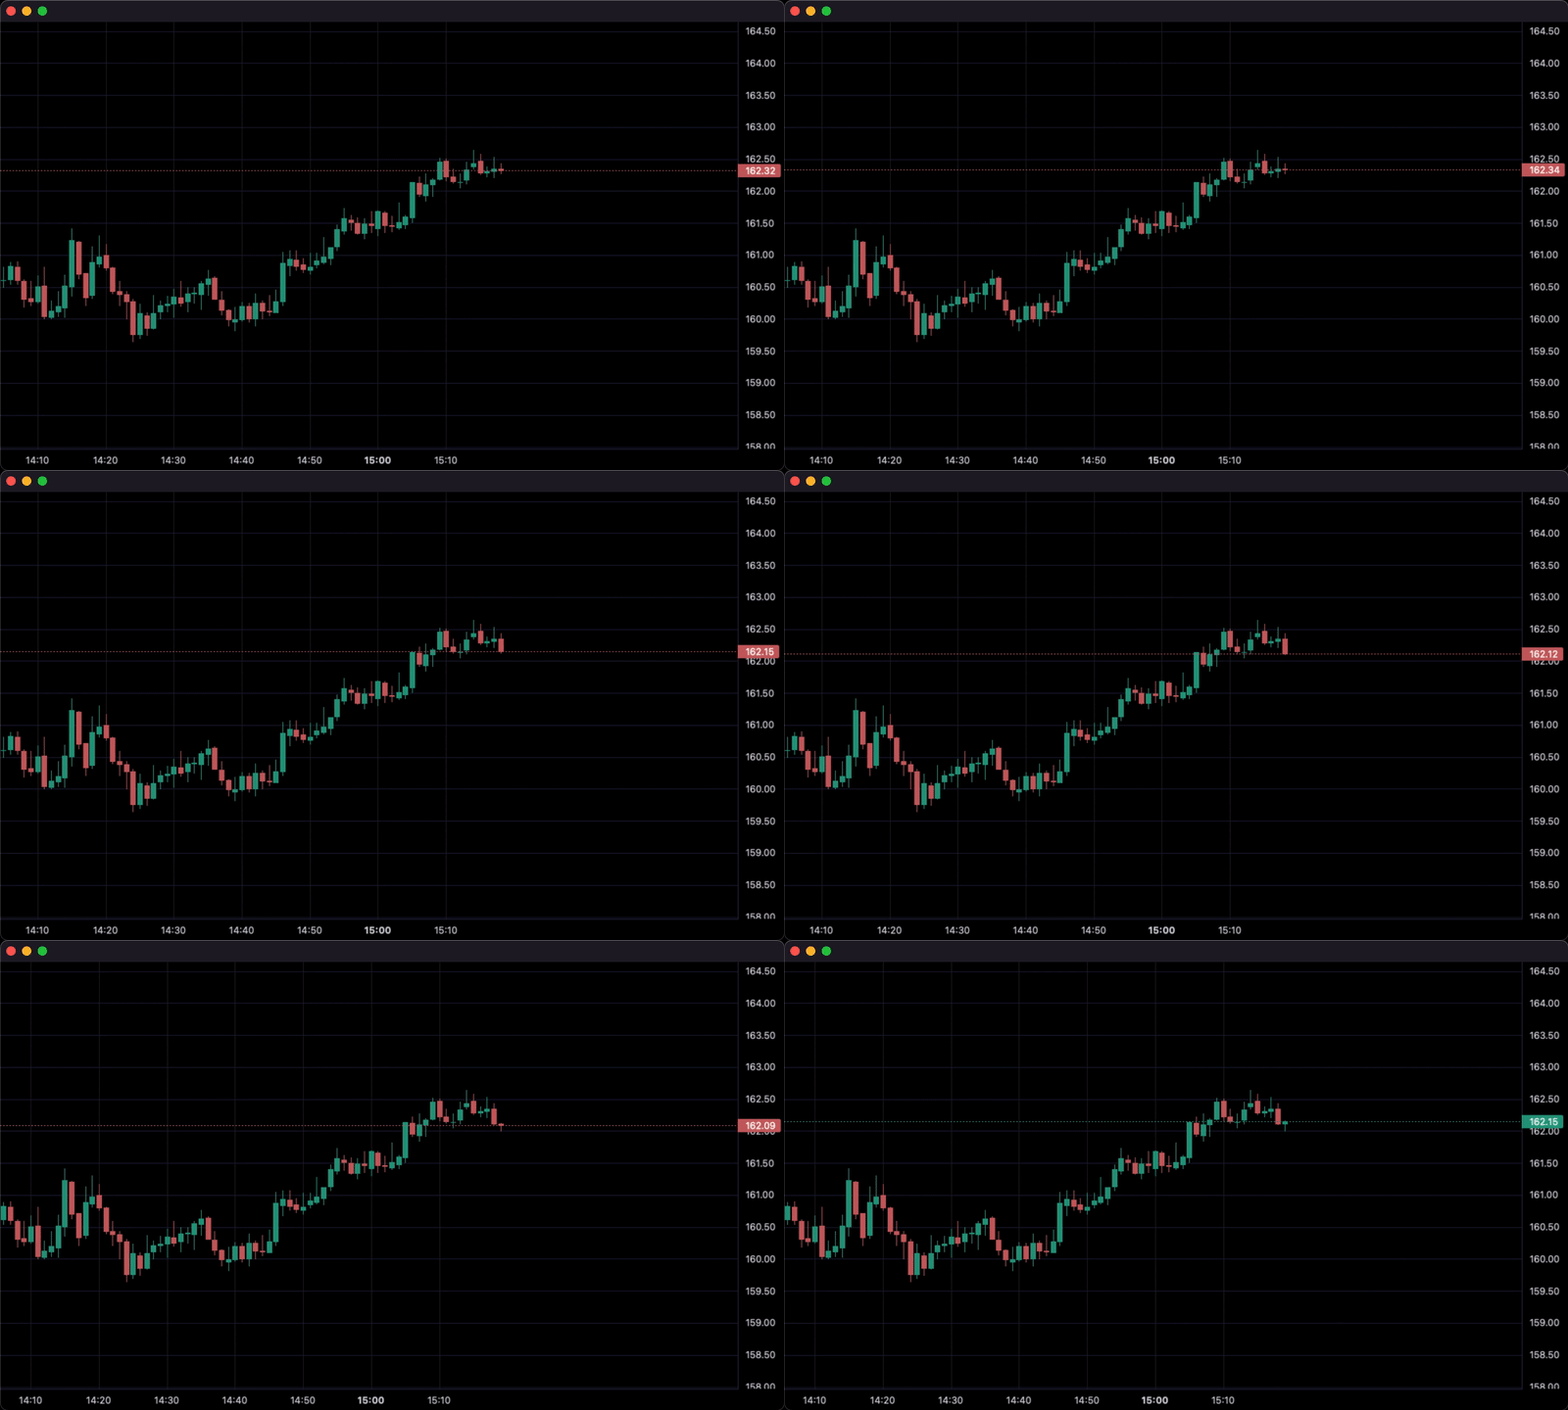
    for i, tick in df2.iterrows():
        chart.update_from_tick(tick)

        sleep(0.03)
4. Line Indicators:
import pandas as pd
from lightweight_charts import Chart


def calculate_sma(df, period: int = 50):
    return pd.DataFrame({
        'time': df['date'],
        f'SMA {period}': df['close'].rolling(window=period).mean()
    }).dropna()


if __name__ == '__main__':
    chart = Chart()
    chart.legend(visible=True)

    df = pd.read_csv('ohlcv.csv')
    chart.set(df)

    line = chart.create_line('SMA 50')
    sma_data = calculate_sma(df, period=50)
    line.set(sma_data)

    chart.show(block=True)
import pandas as pd
from lightweight_charts import Chart


def get_bar_data(symbol, timeframe):
    if symbol not in ('AAPL', 'GOOGL', 'TSLA'):
        print(f'No data for "{symbol}"')
        return pd.DataFrame()
    return pd.read_csv(f'bar_data/{symbol}_{timeframe}.csv')


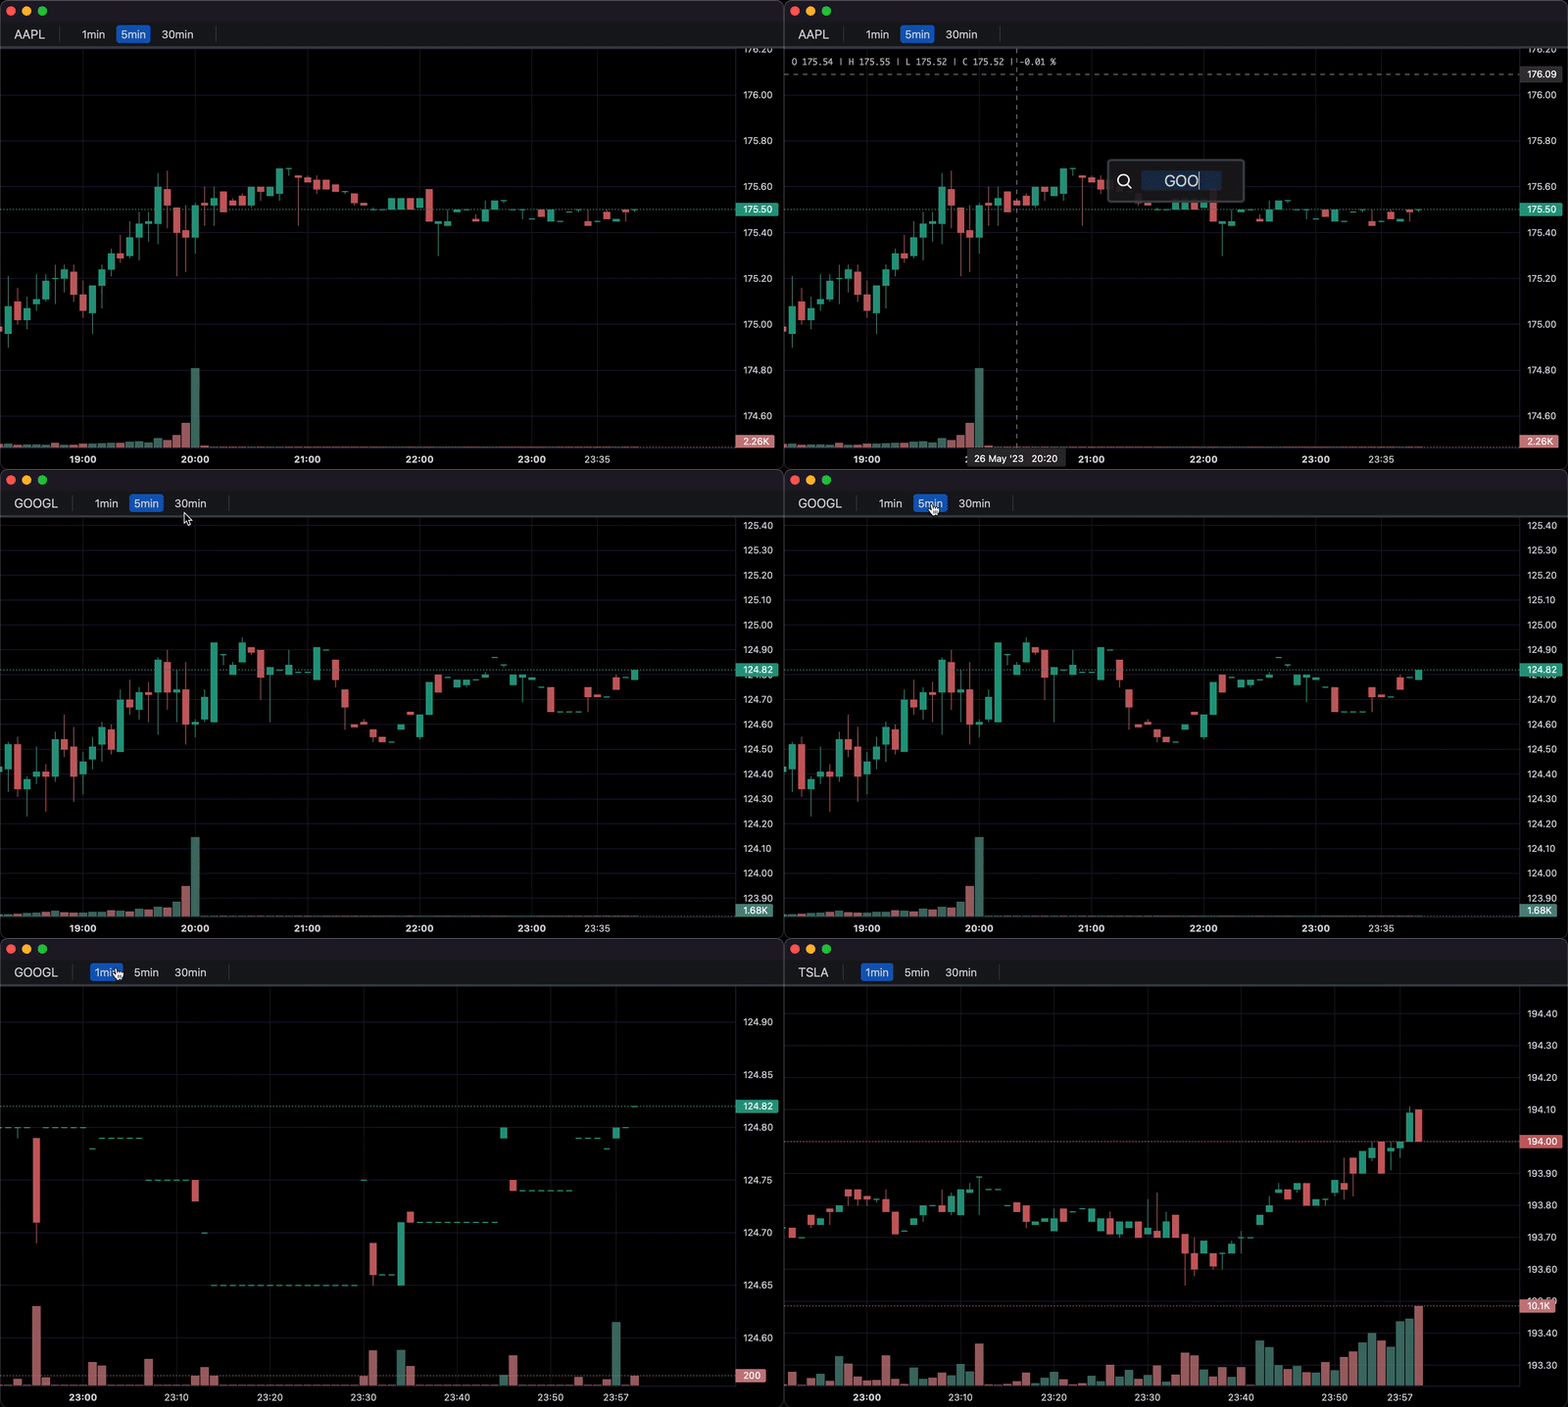
def on_search(chart, searched_string):  # Called when the user searches.
    new_data = get_bar_data(searched_string, chart.topbar['timeframe'].value)
    if new_data.empty:
        return
    chart.topbar['symbol'].set(searched_string)
    chart.set(new_data)


def on_timeframe_selection(chart):  # Called when the user changes the timeframe.
    new_data = get_bar_data(chart.topbar['symbol'].value, chart.topbar['timeframe'].value)
    if new_data.empty:
        return
    chart.set(new_data, True)


def on_horizontal_line_move(chart, line):
    print(f'Horizontal line moved to: {line.price}')


if __name__ == '__main__':
    chart = Chart(toolbox=True)
    chart.legend(True)

    chart.events.search += on_search

    chart.topbar.textbox('symbol', 'TSLA')
    chart.topbar.switcher('timeframe', ('1min', '5min', '30min'), default='5min',
                          func=on_timeframe_selection)

    df = get_bar_data('TSLA', '5min')
    chart.set(df)

    chart.horizontal_line(200, func=on_horizontal_line_move)

    chart.show(block=True)
This package is an independent creation and has not been endorsed, sponsored, or approved by TradingView. The author of this package does not have any official relationship with TradingView, and the package does not represent the views or opinions of TradingView.